Century 21 People’s Choice Realty Inc., Brokerage
120 MATHESON BLVD E #103
MISSISSAUGA, Ontario
L4Z 1X1


Milton, FO Ford, L9E 1E5
$1,850,000
Listed by CENTURY 21 GREEN REALTY INC..
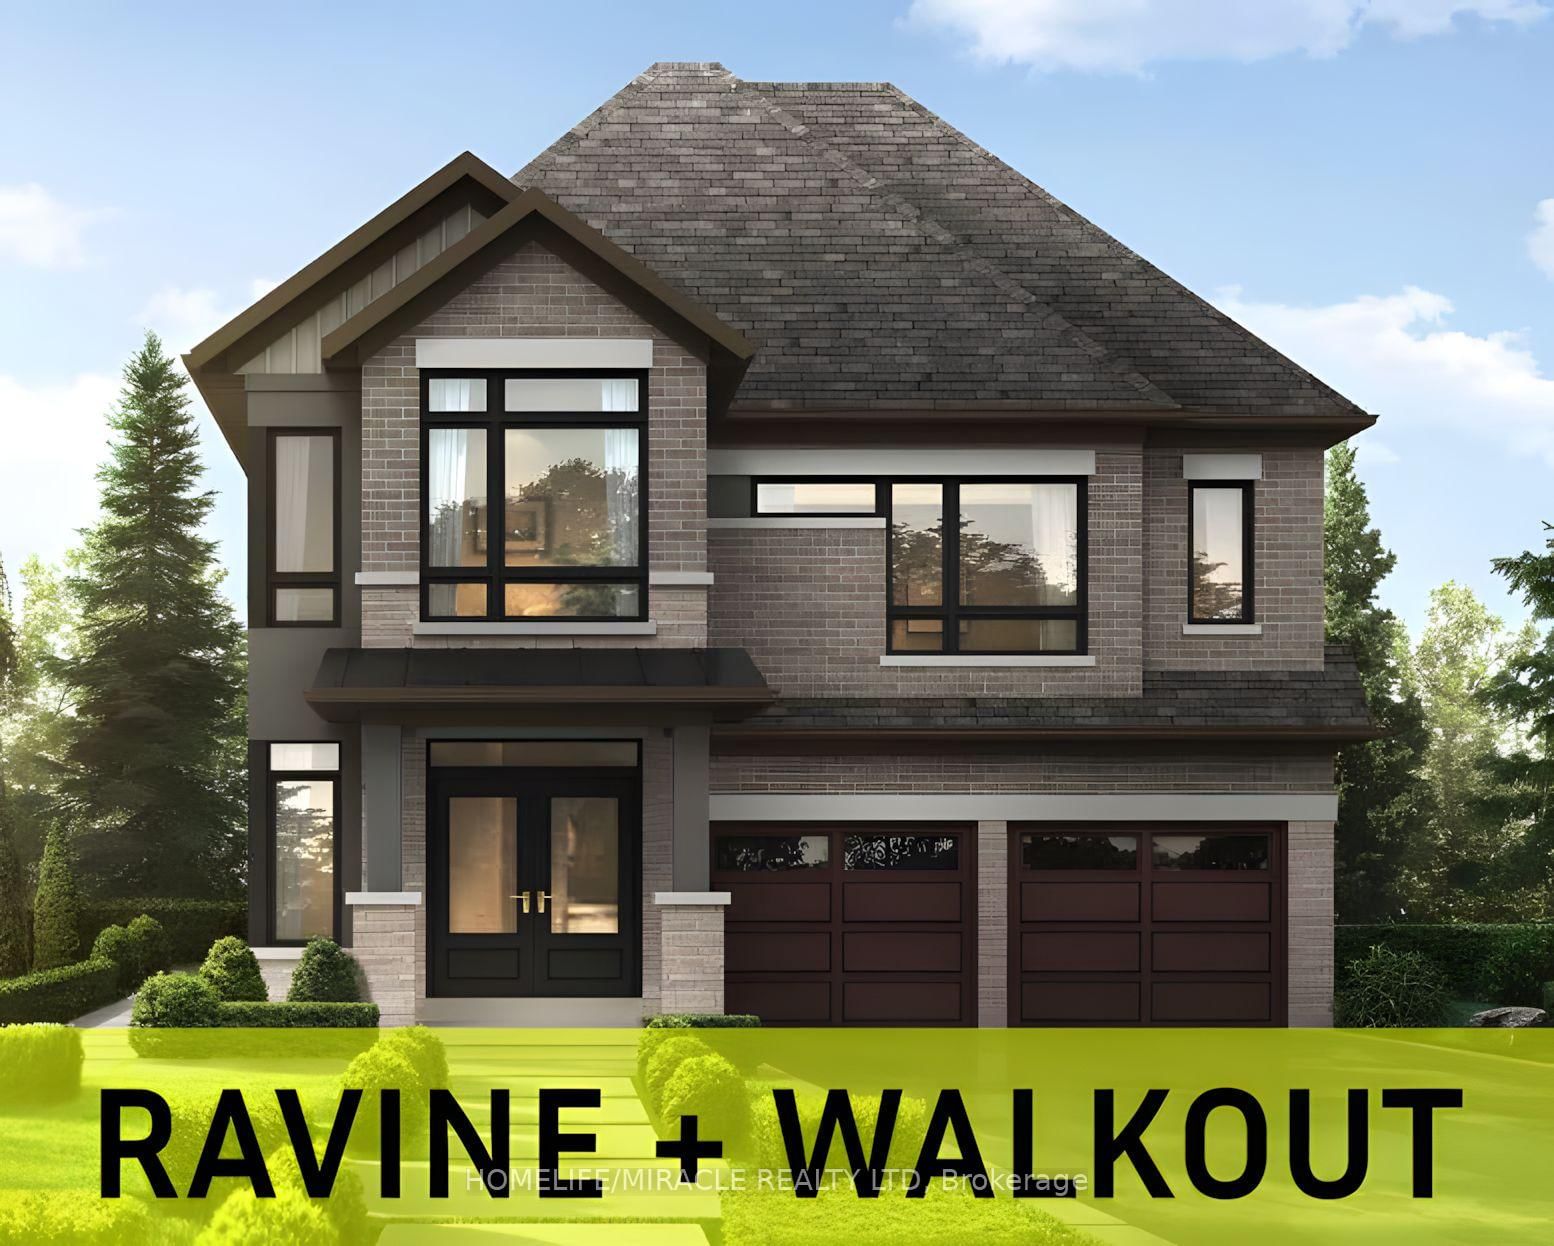
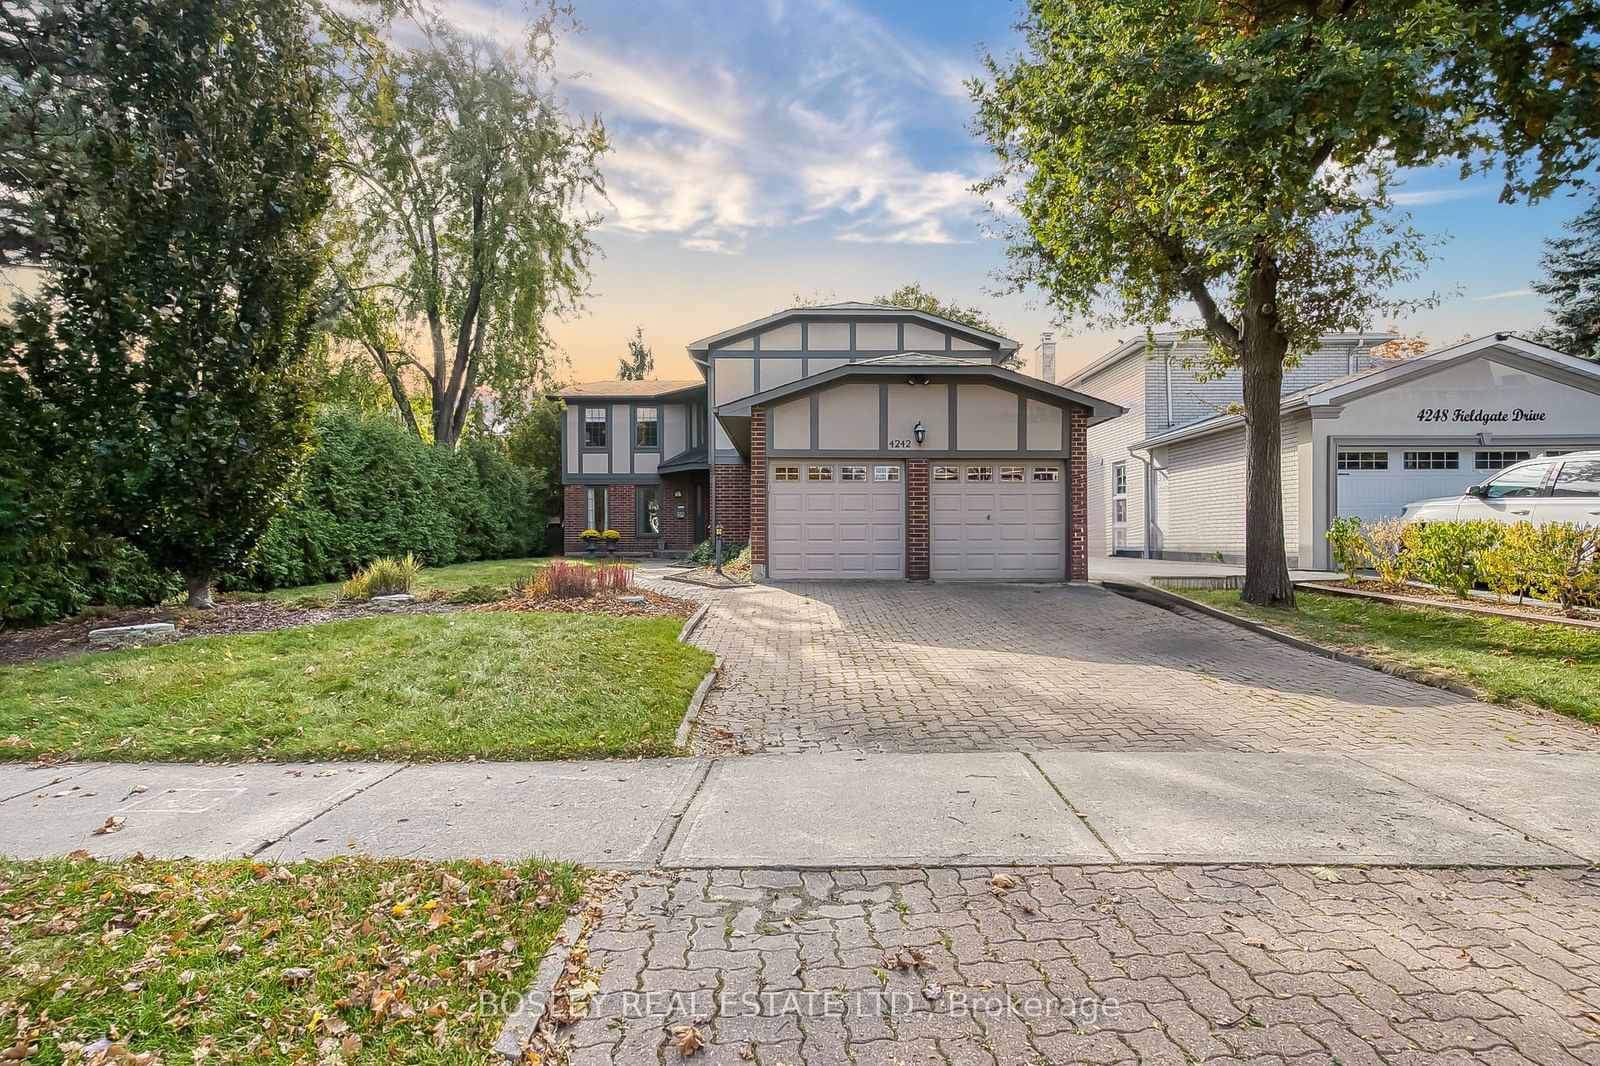
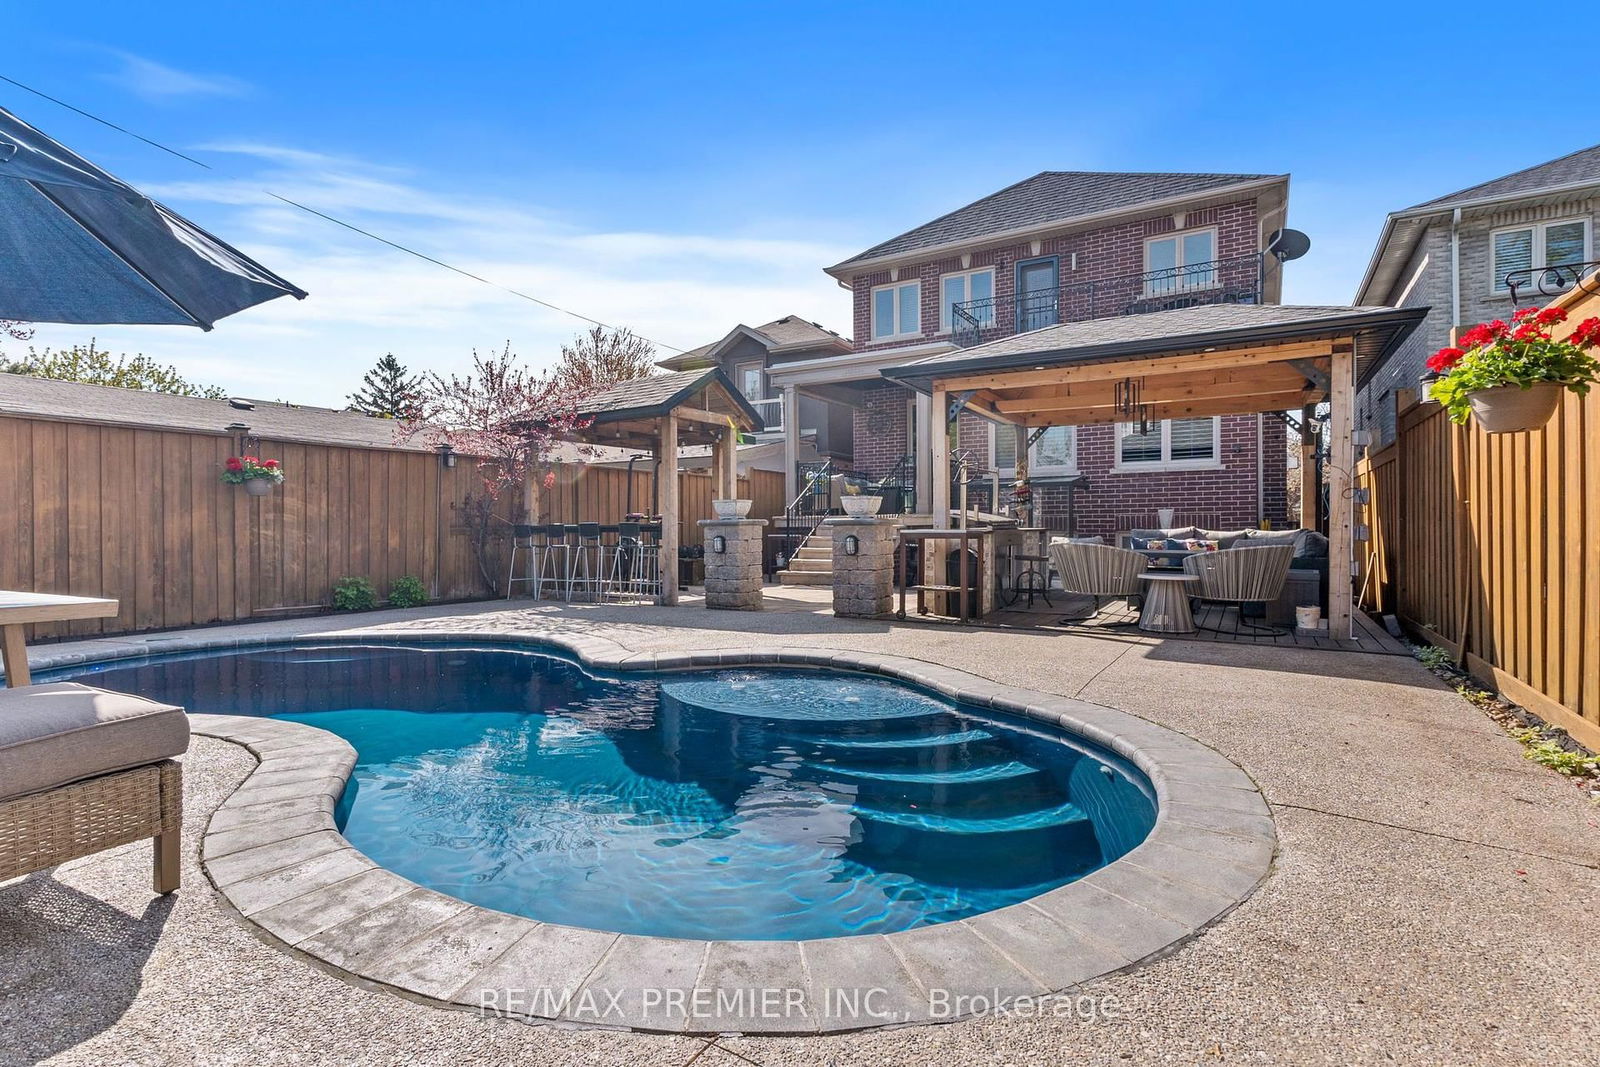
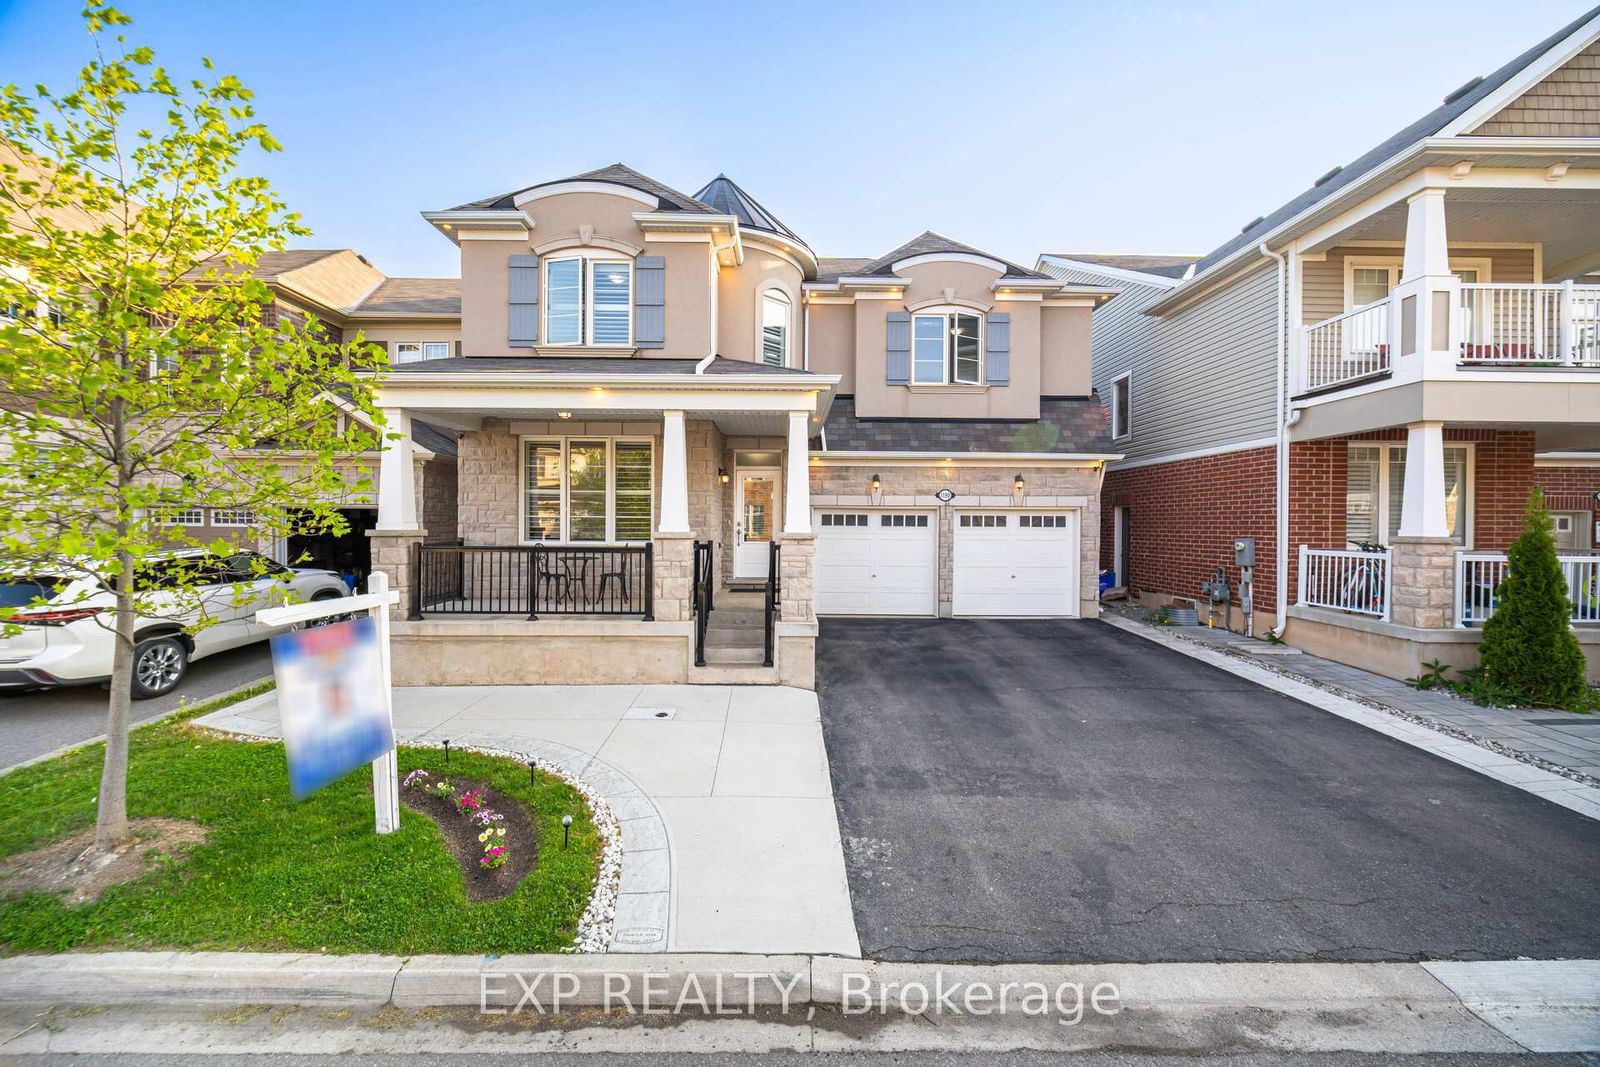
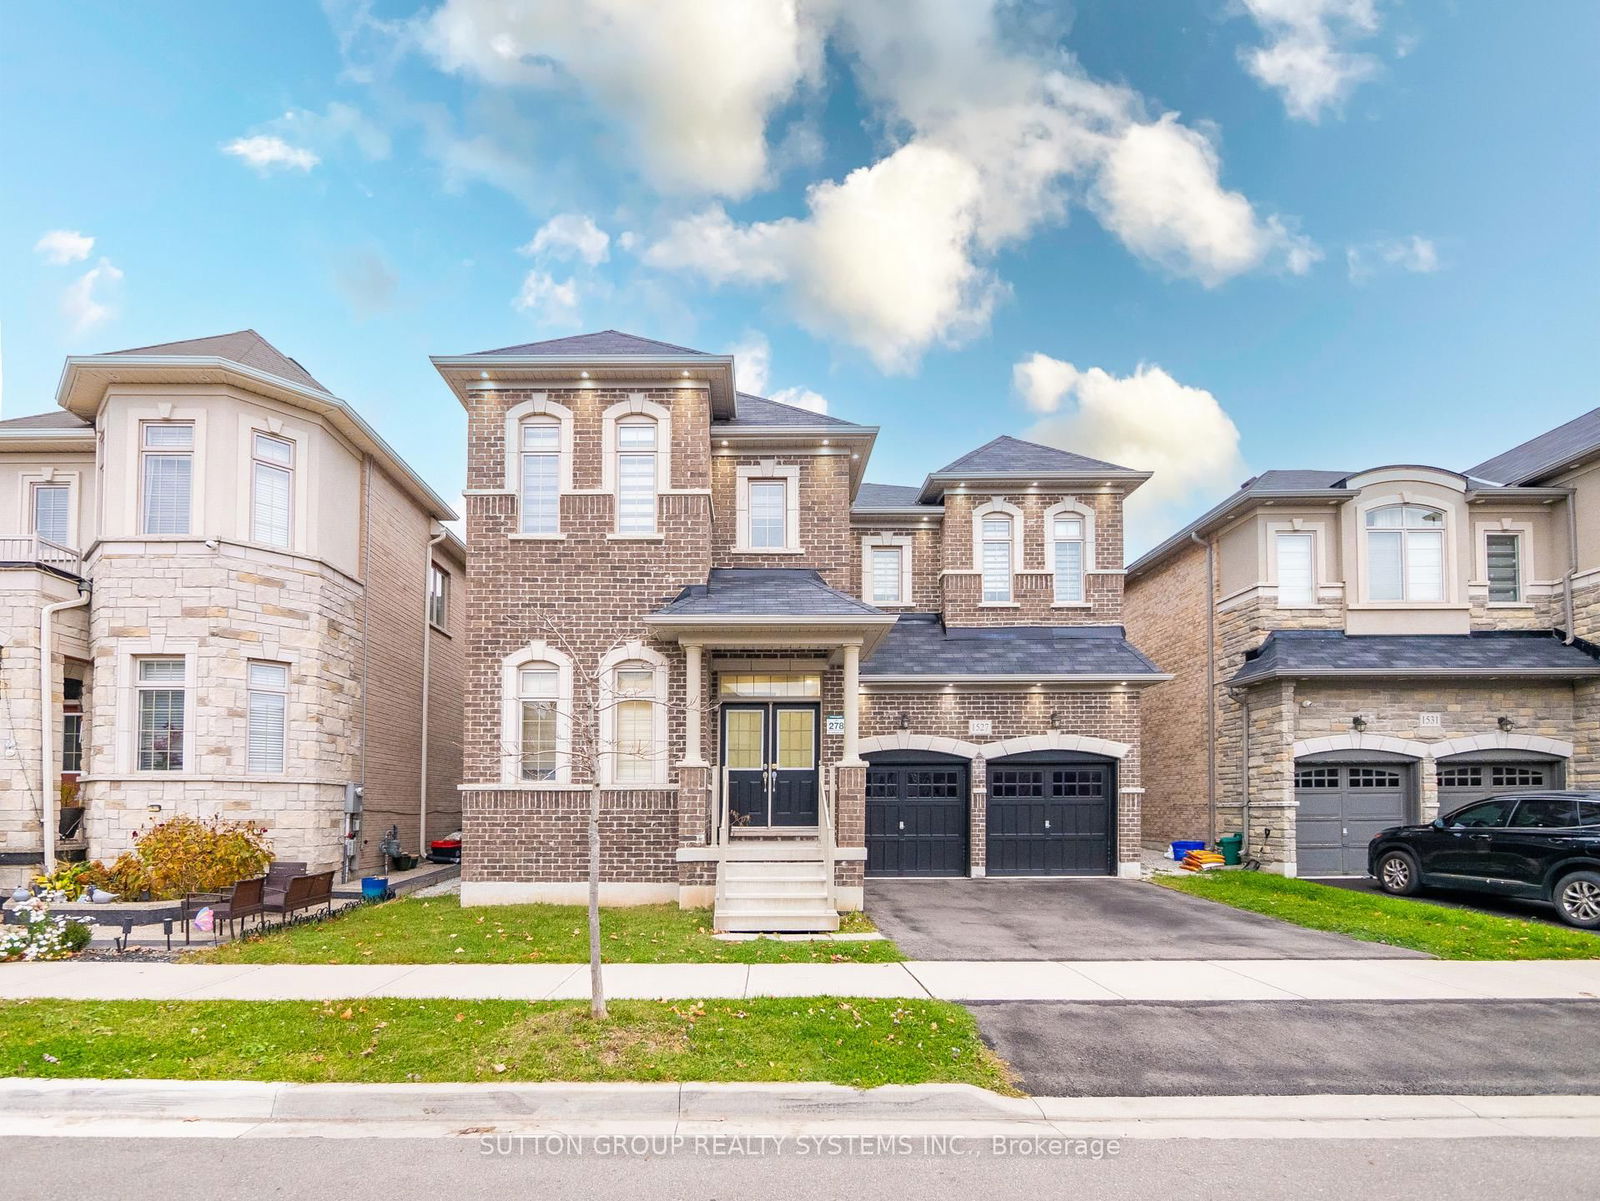
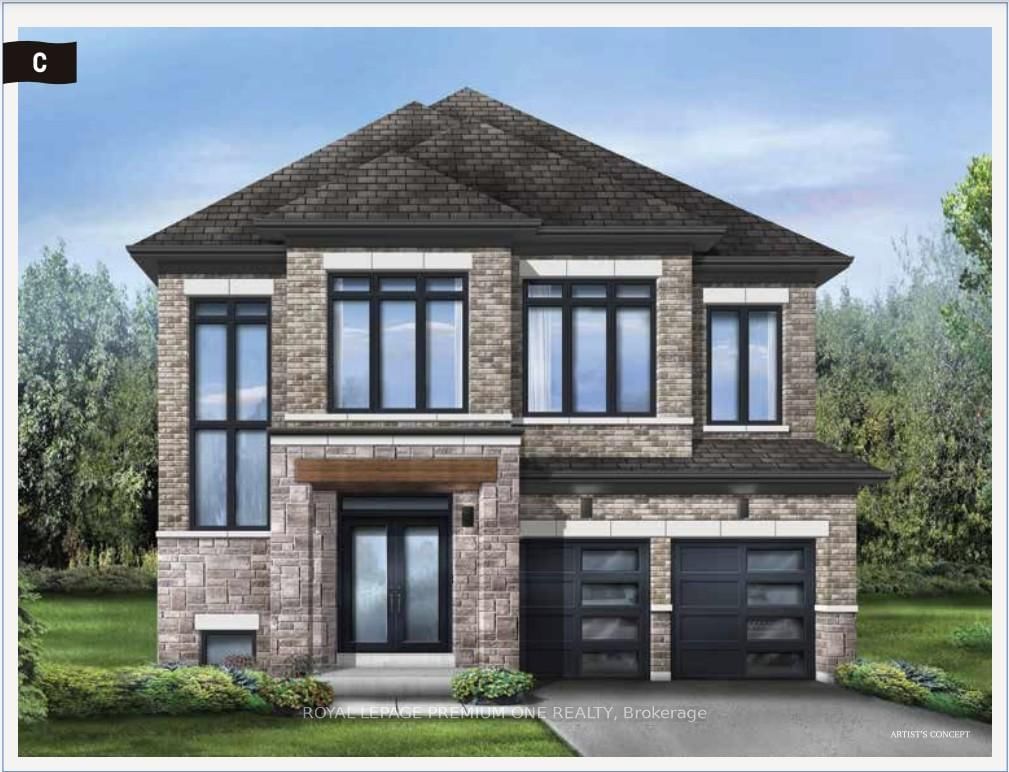
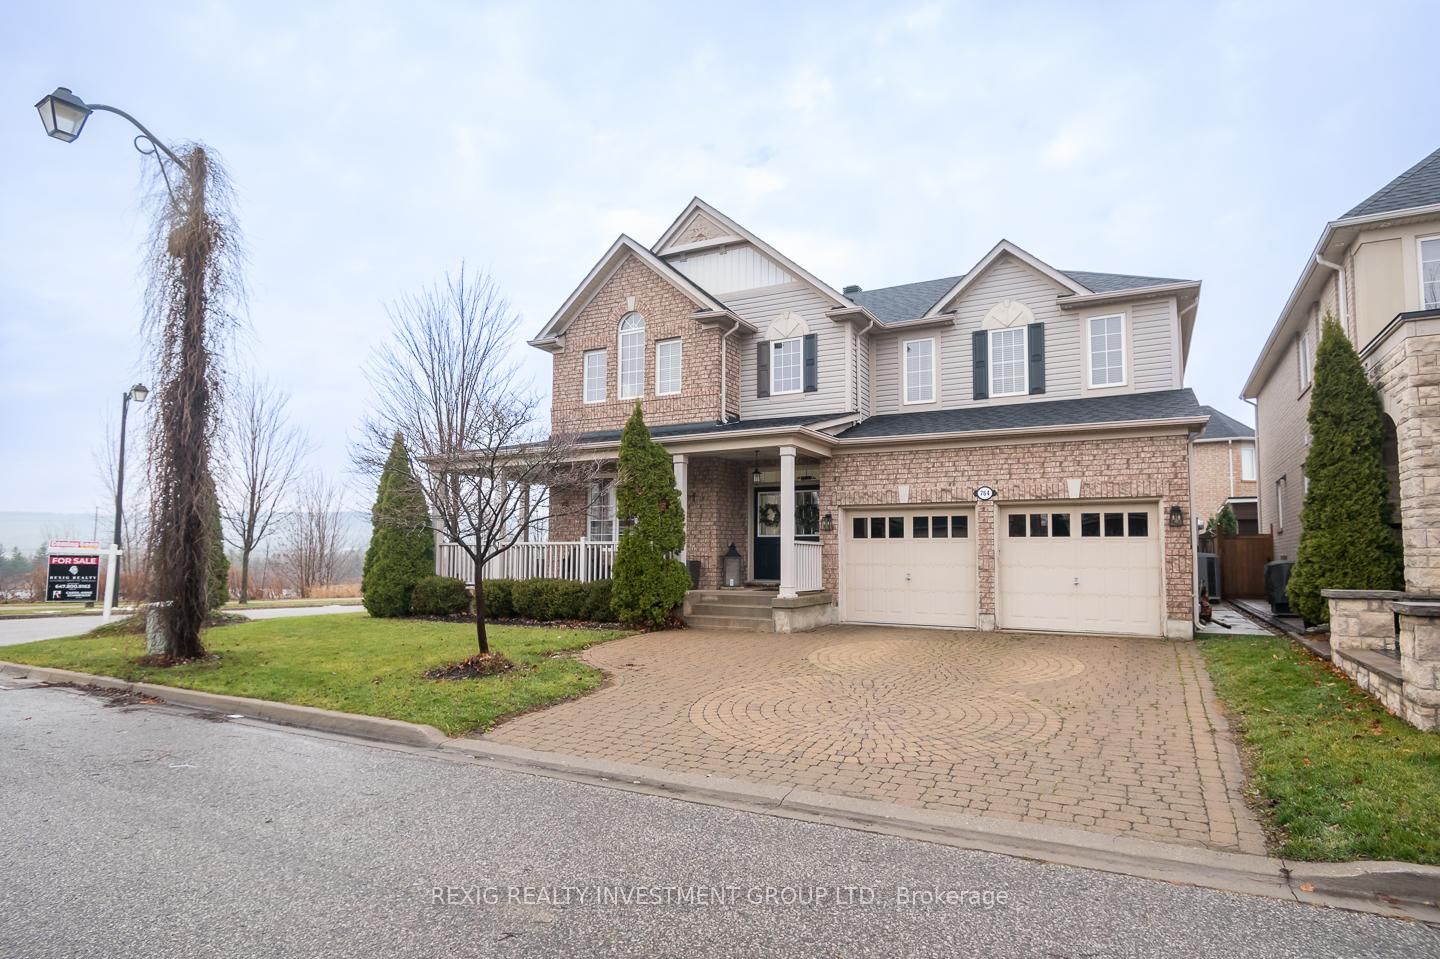
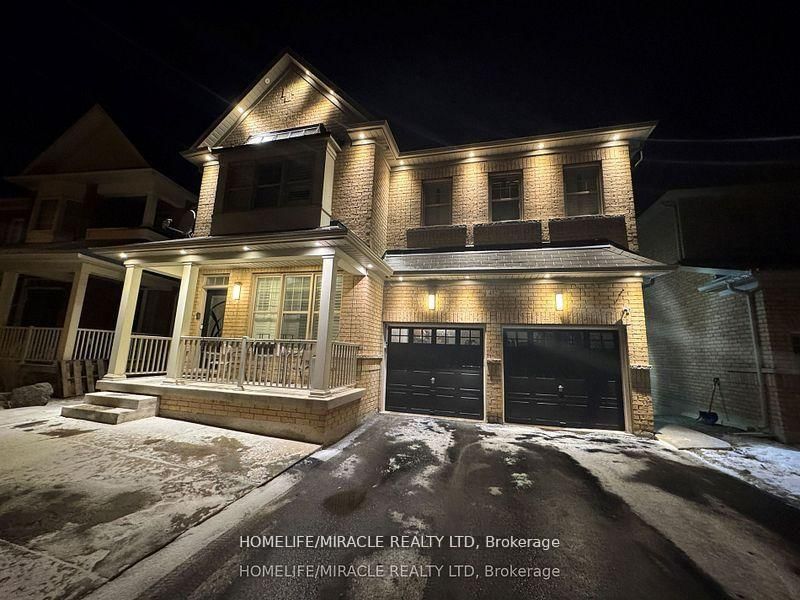
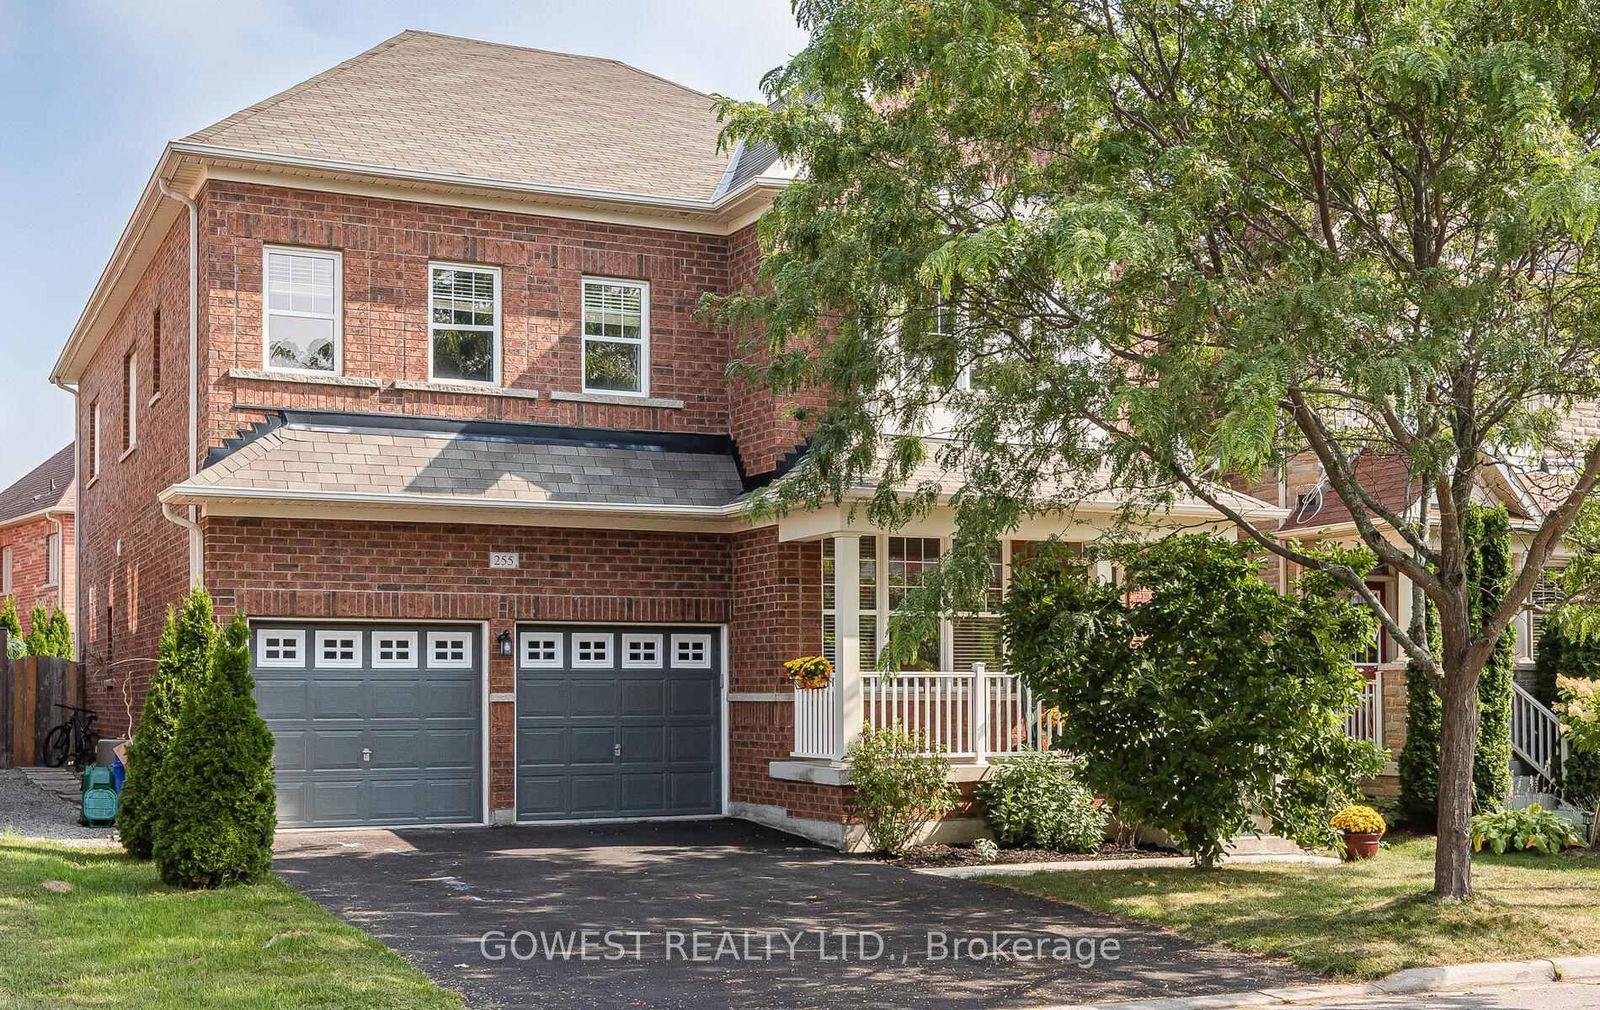
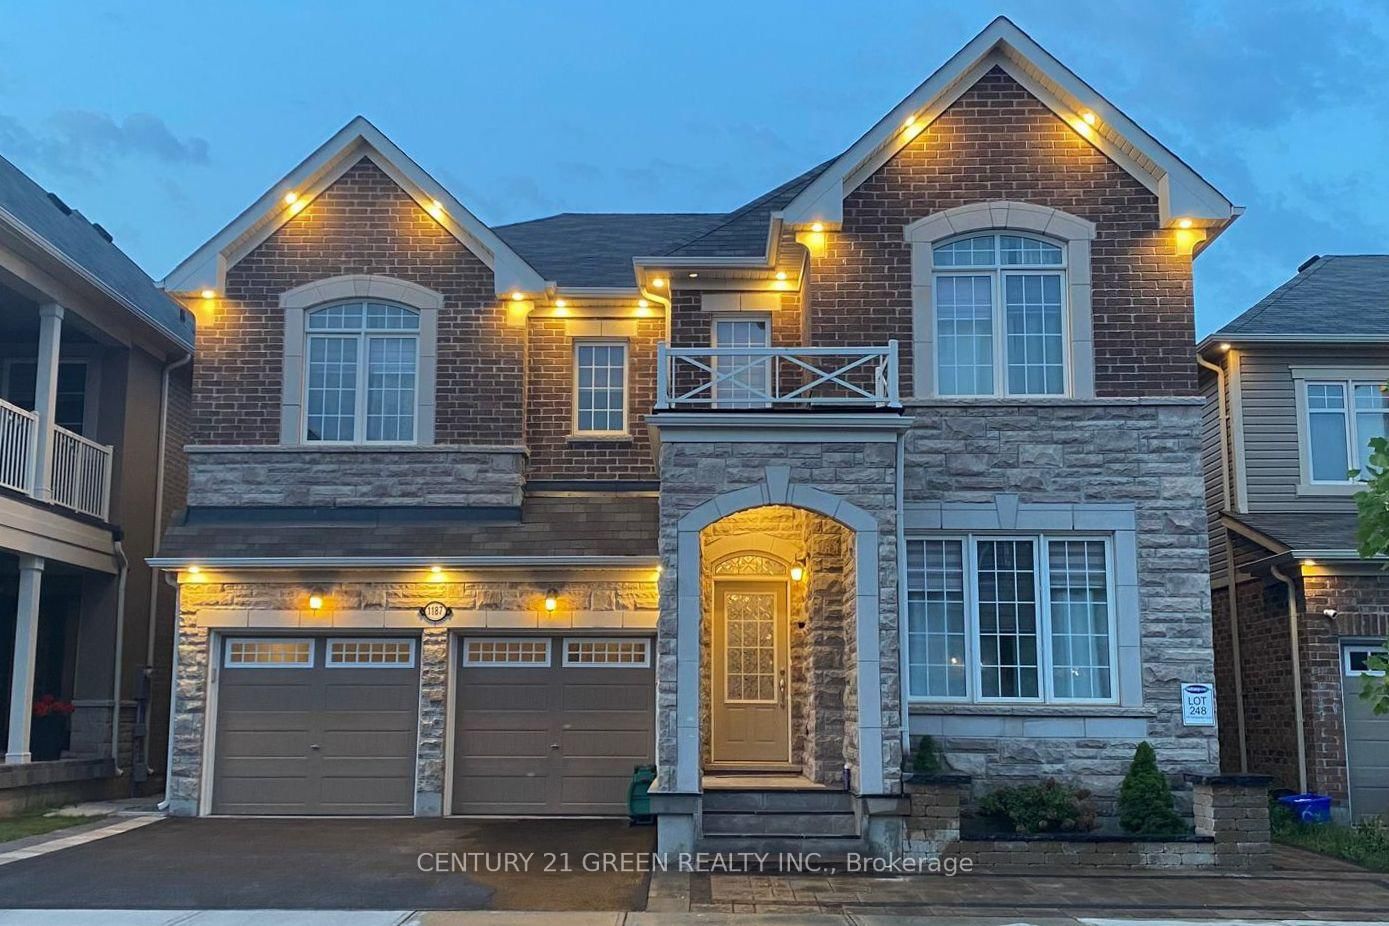
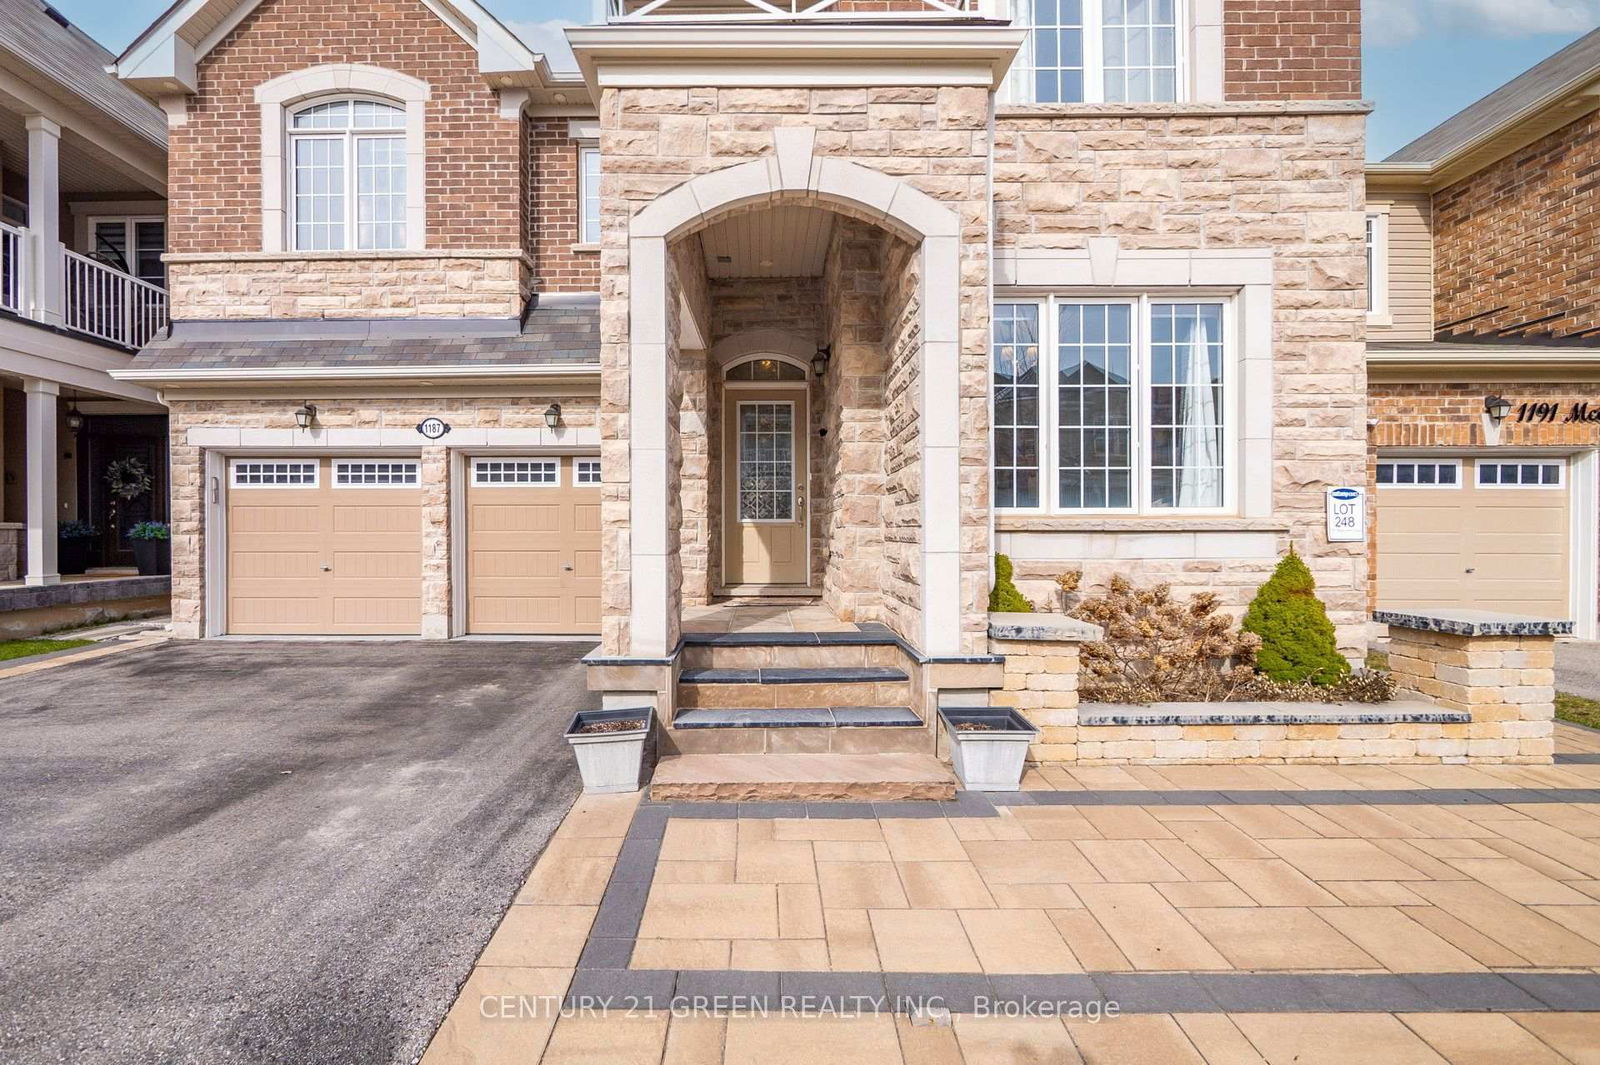
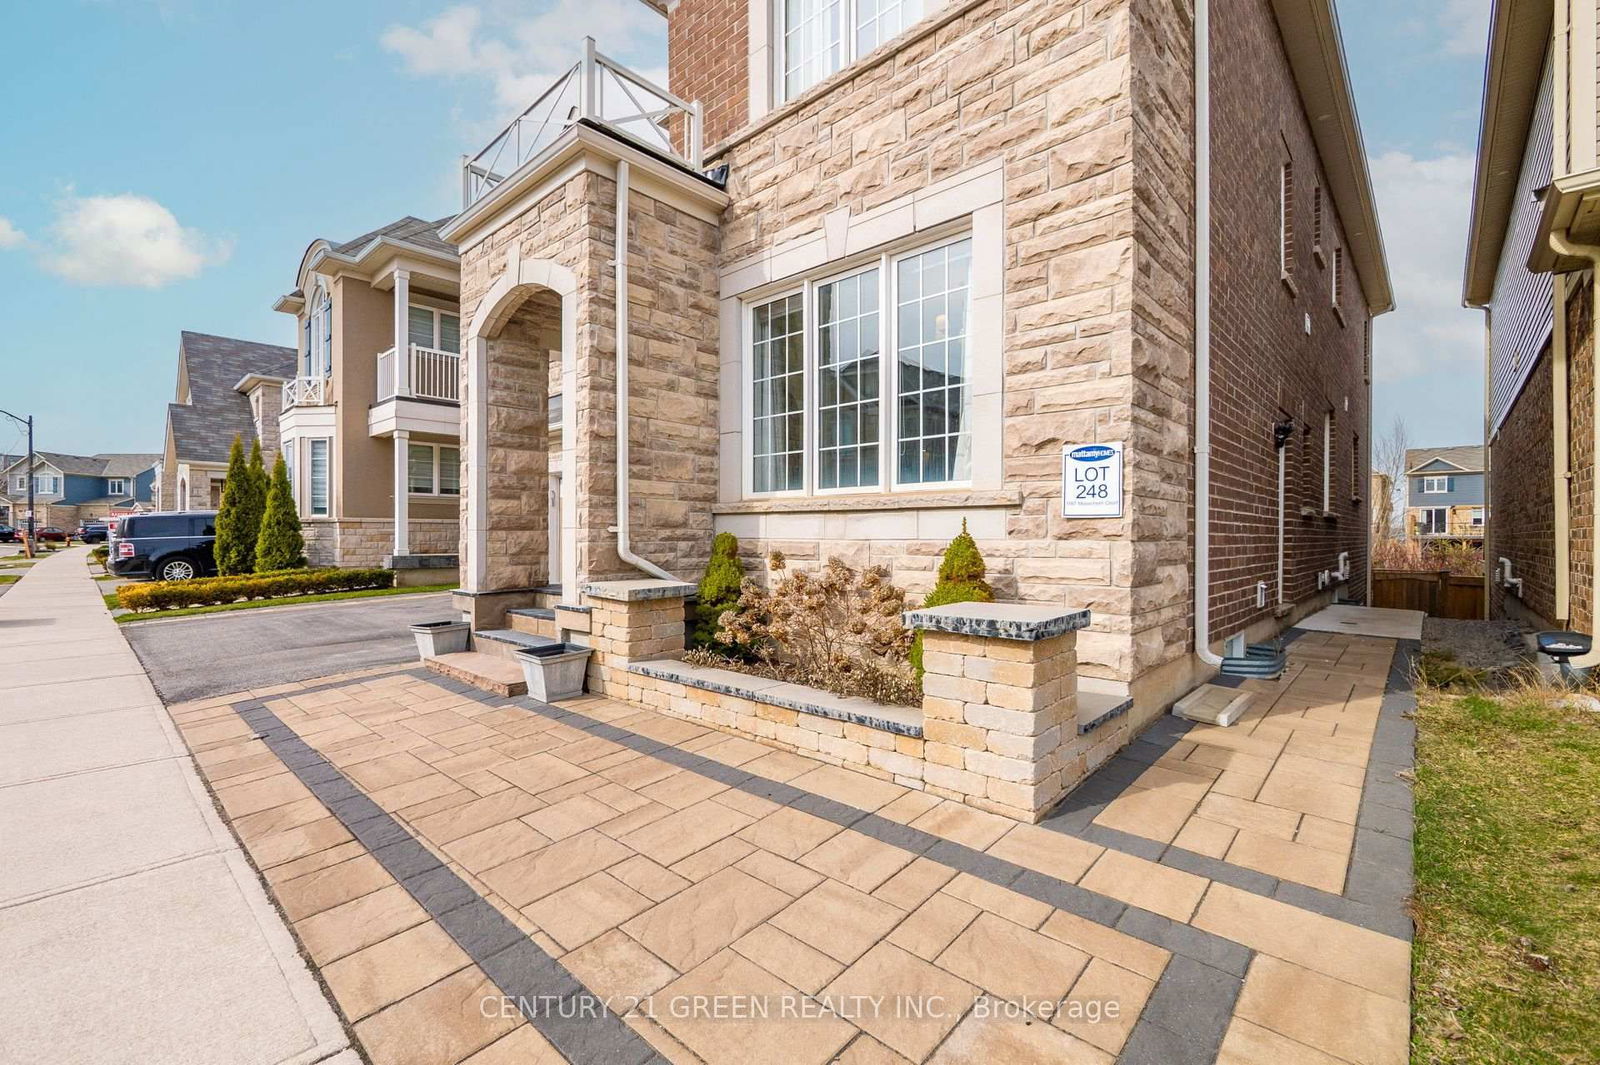
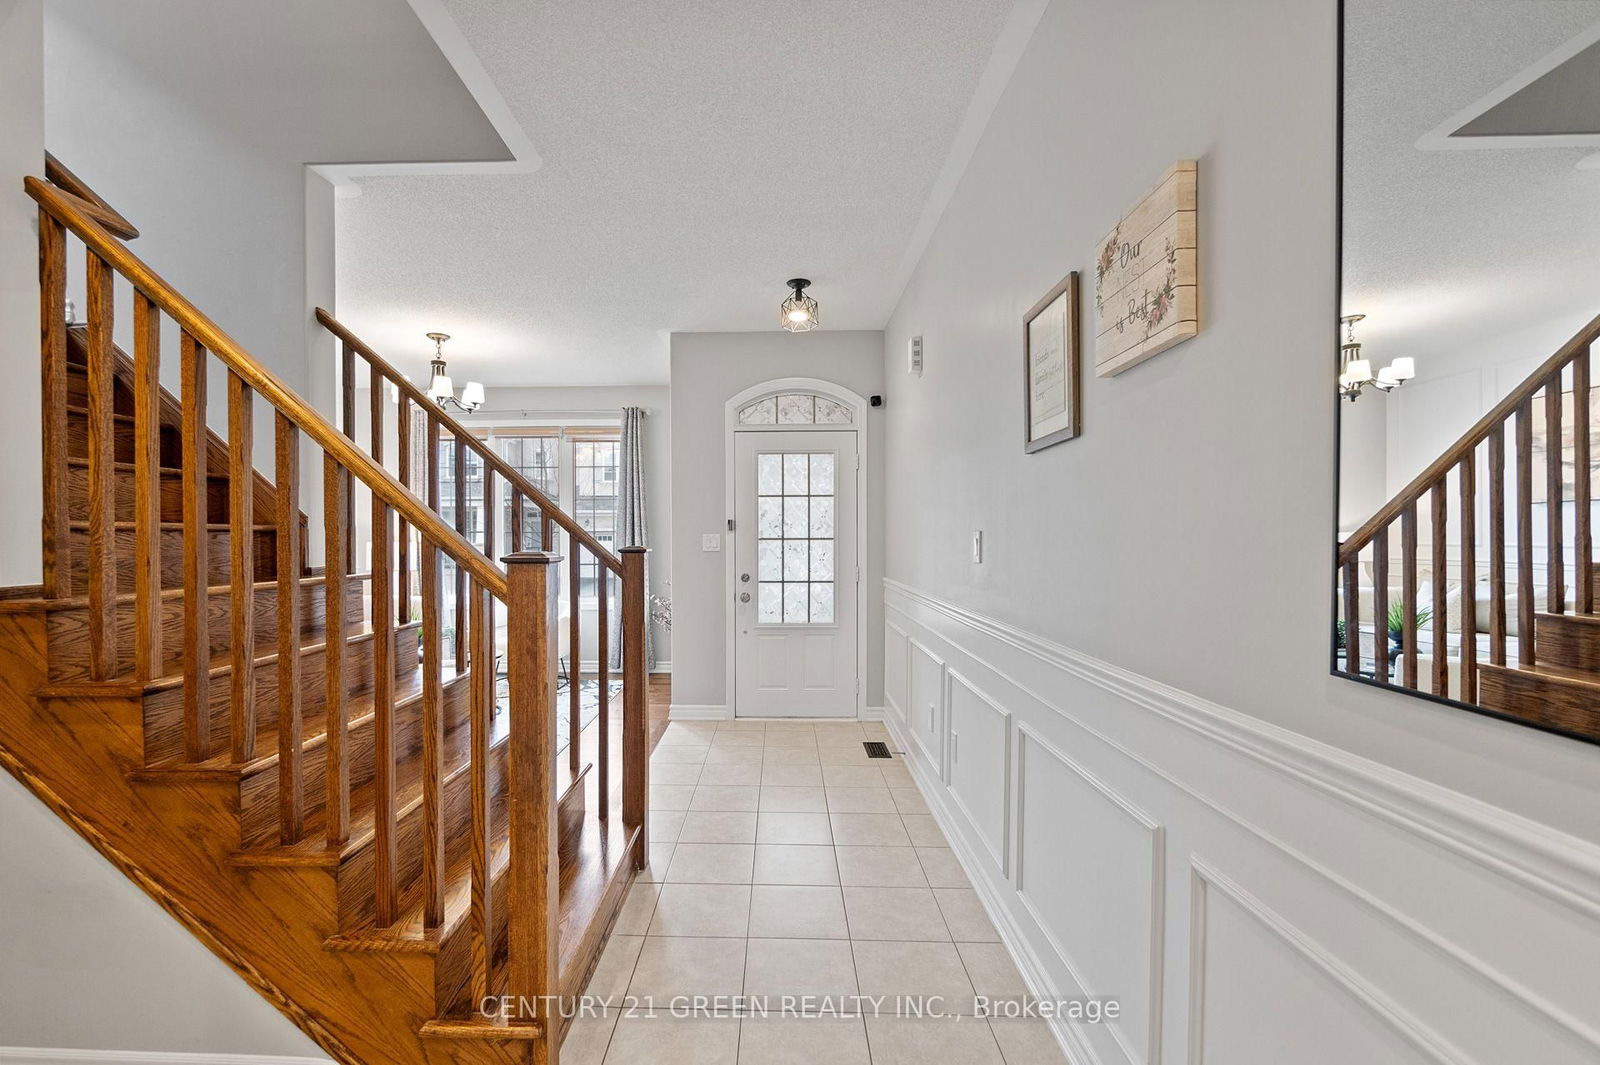
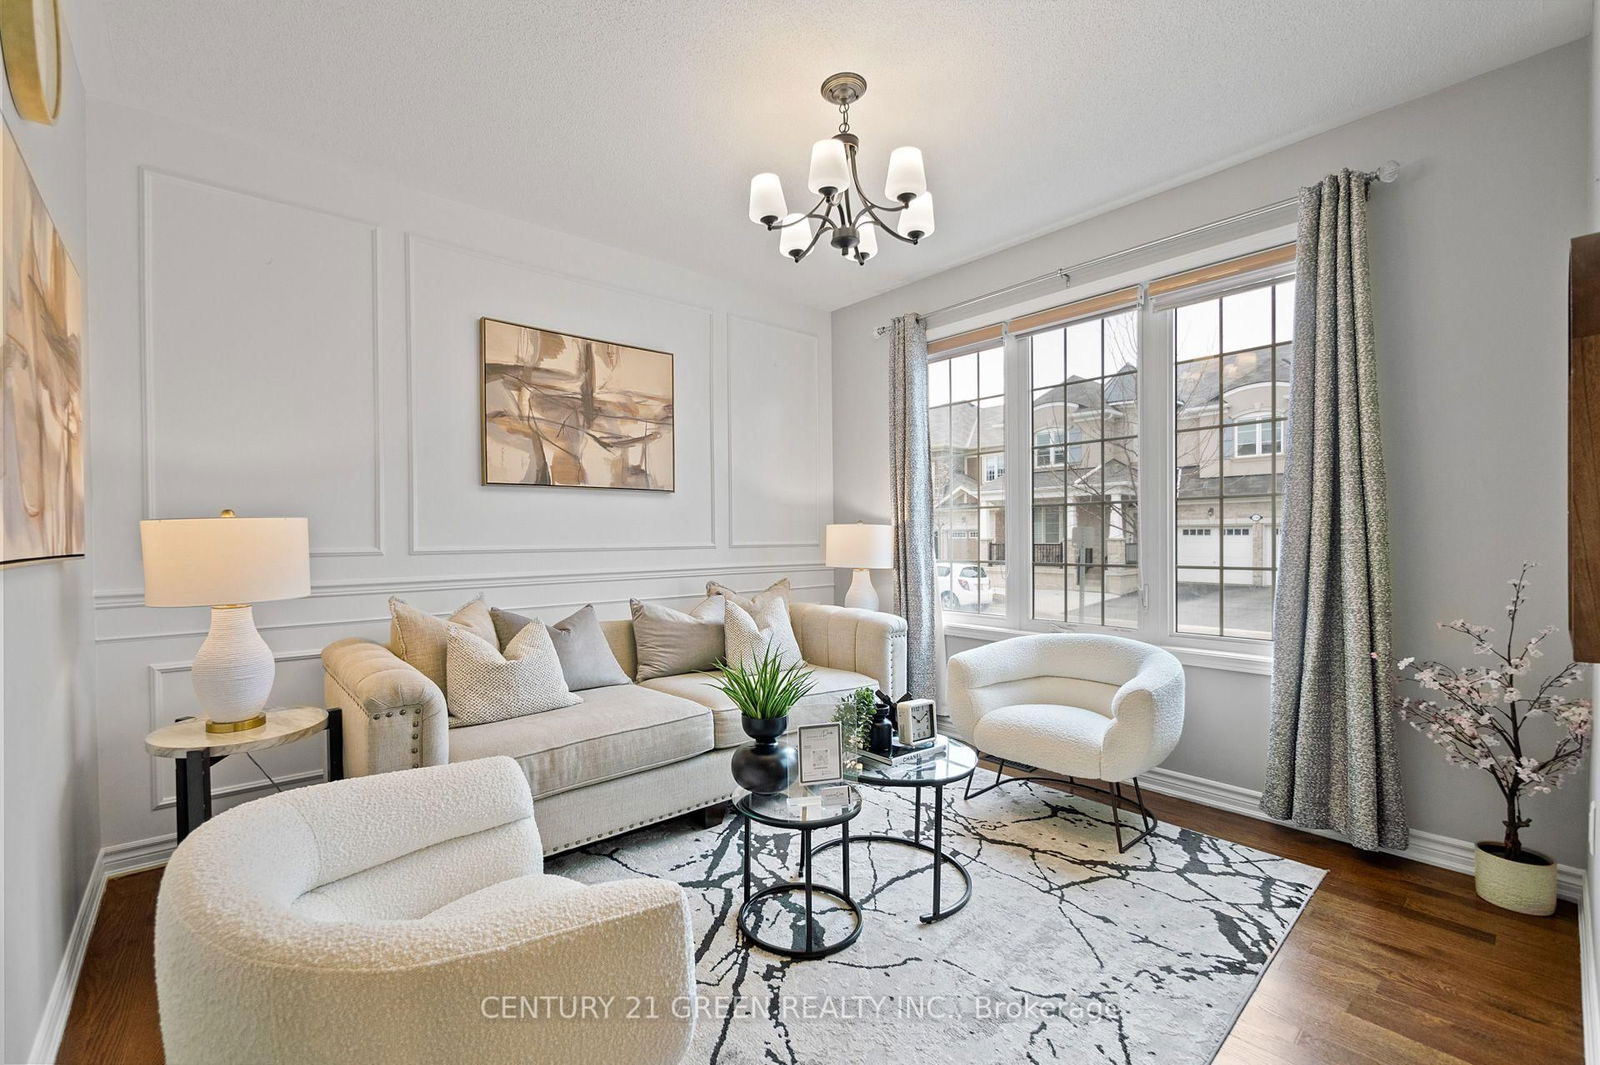
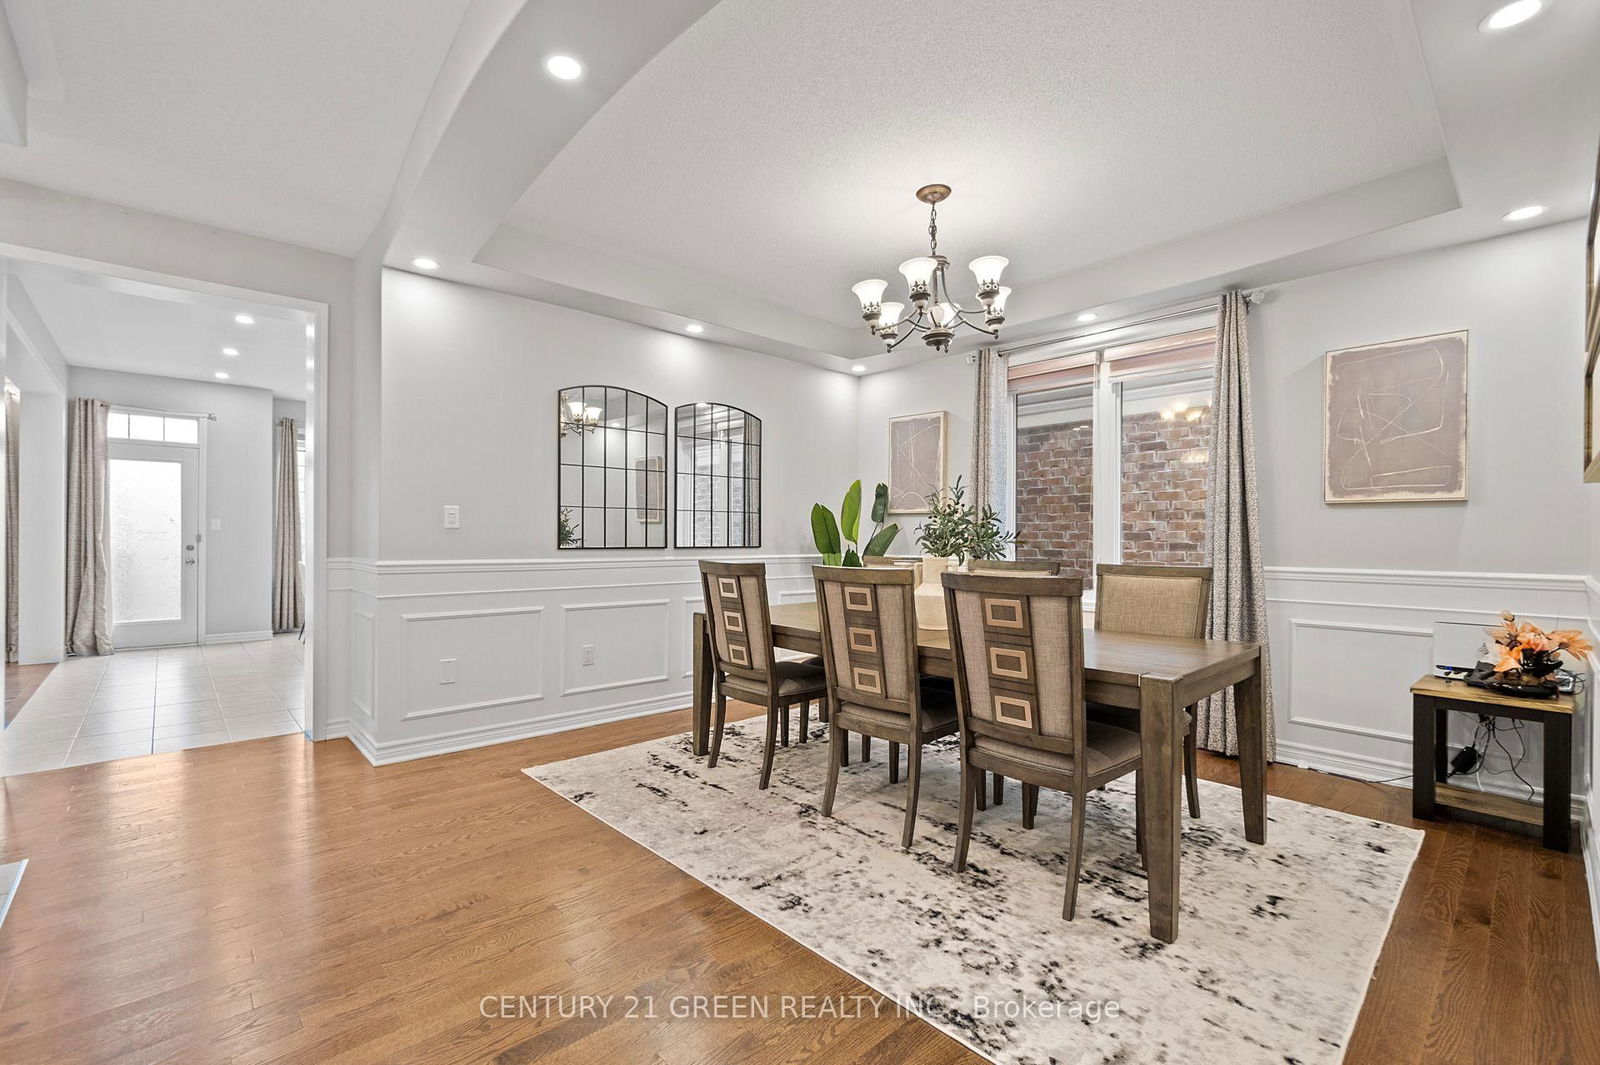
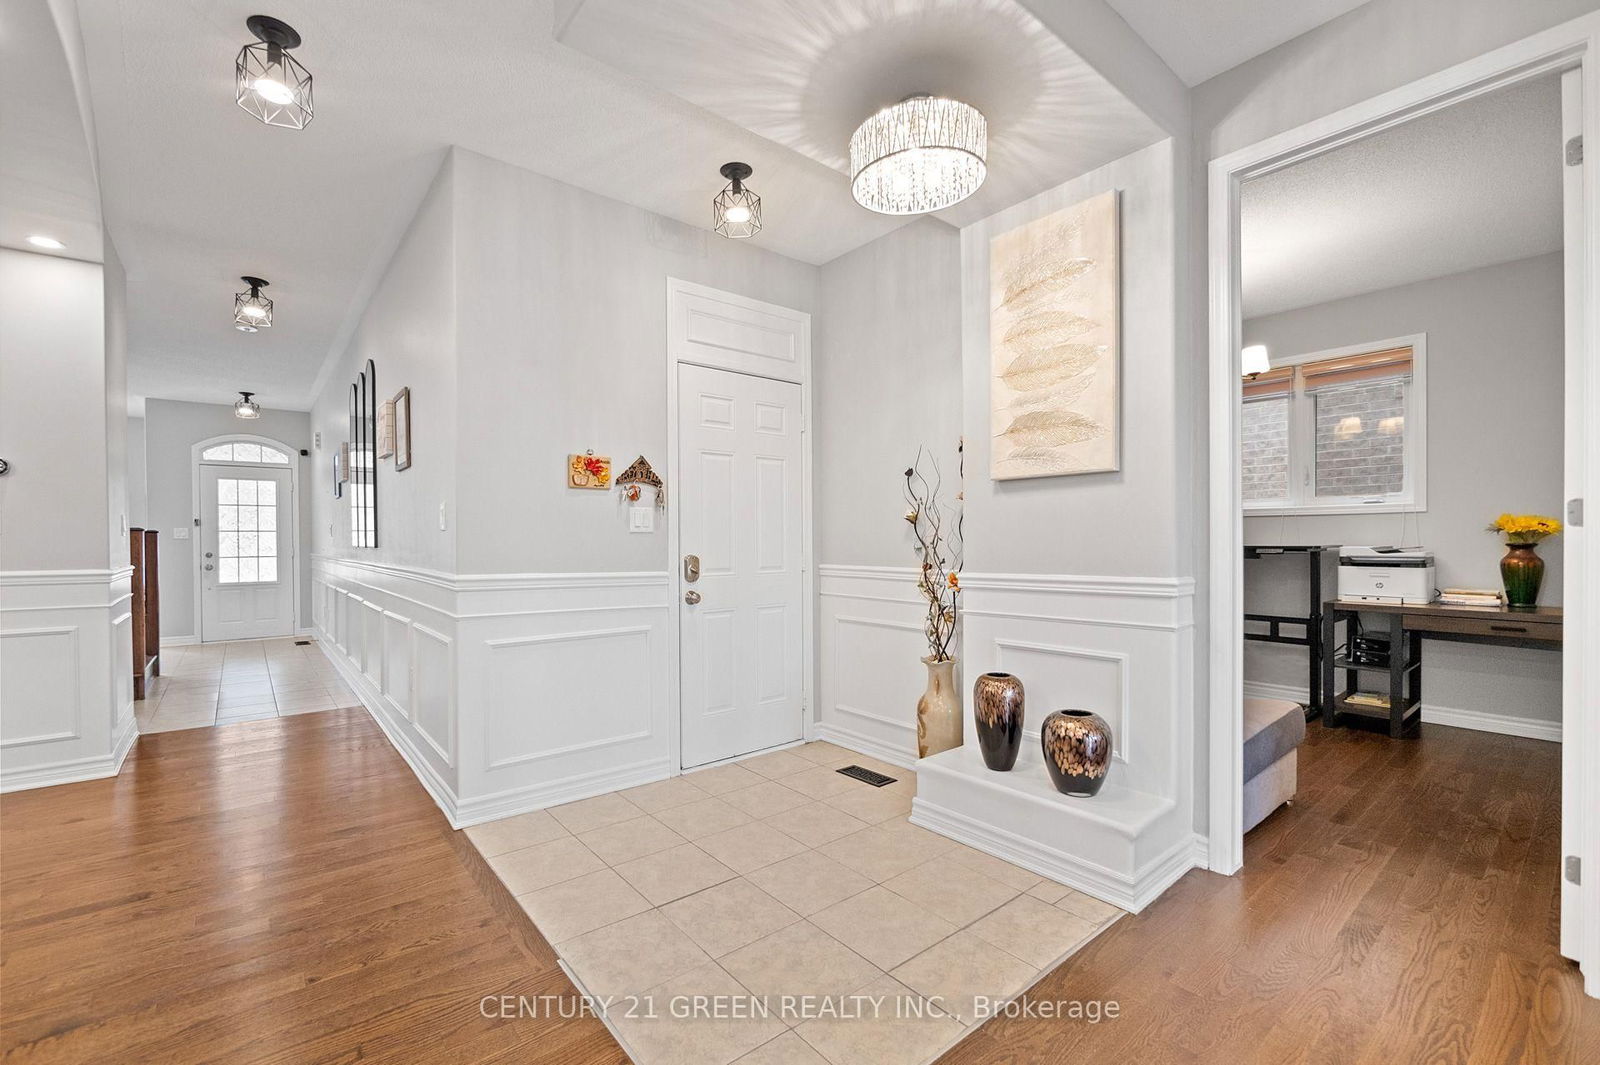
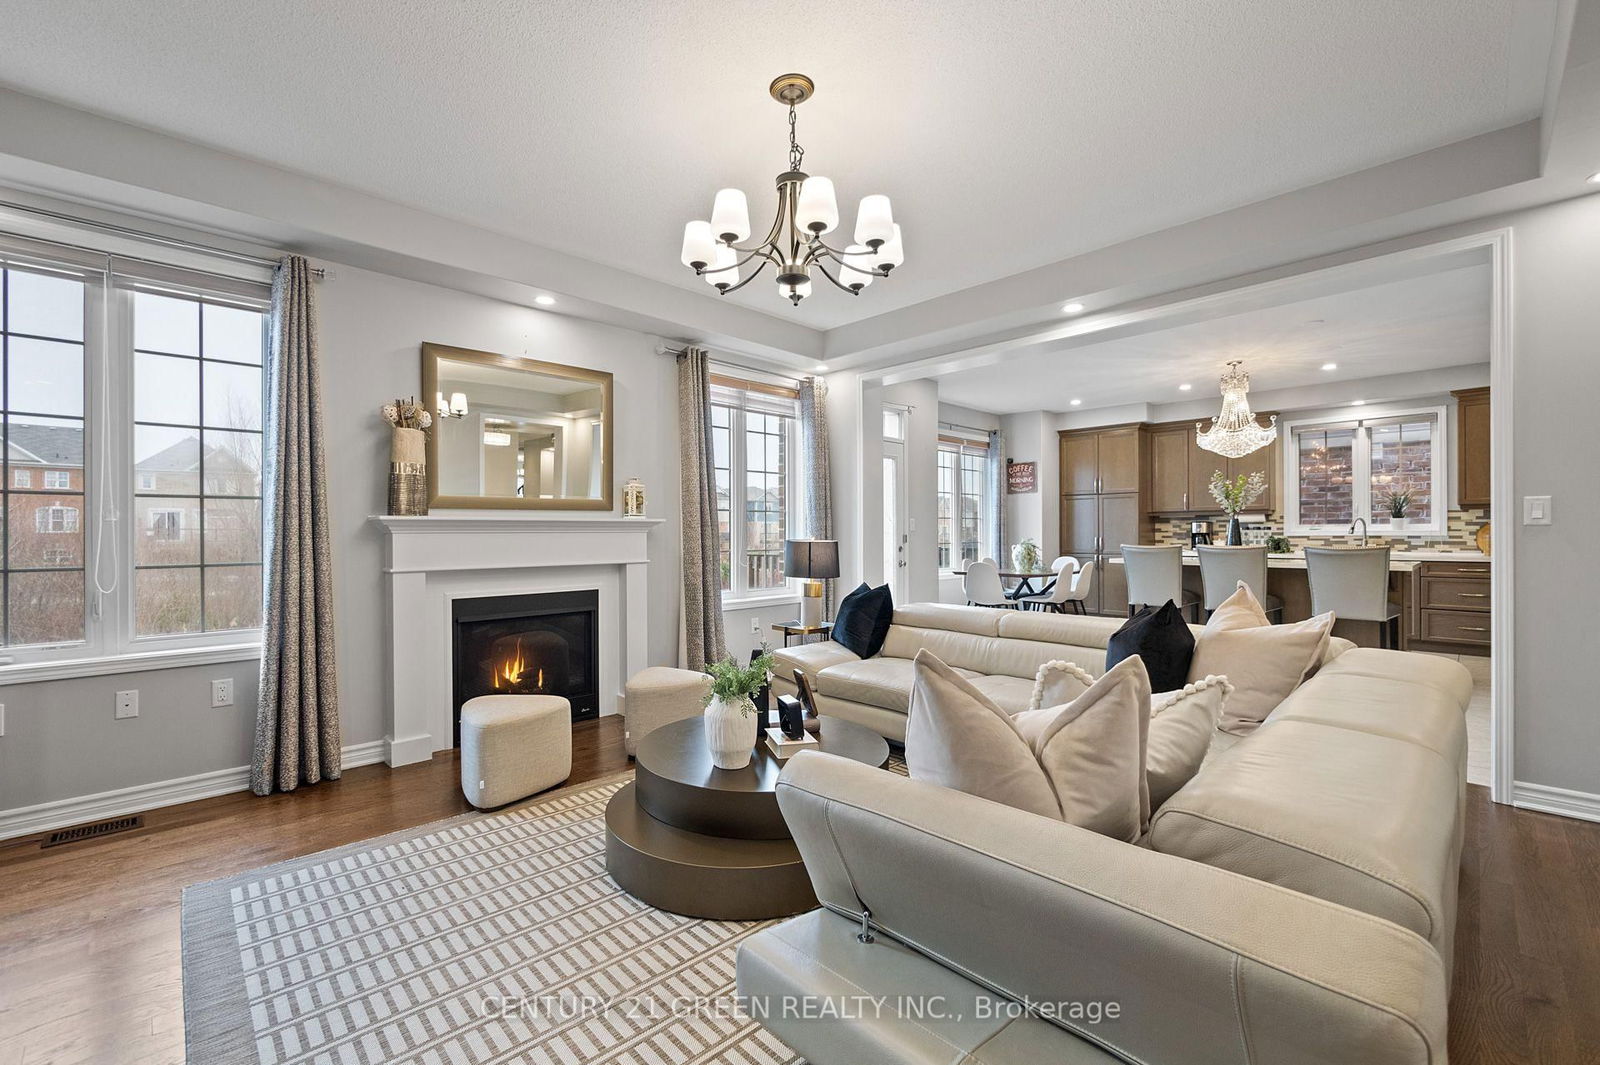
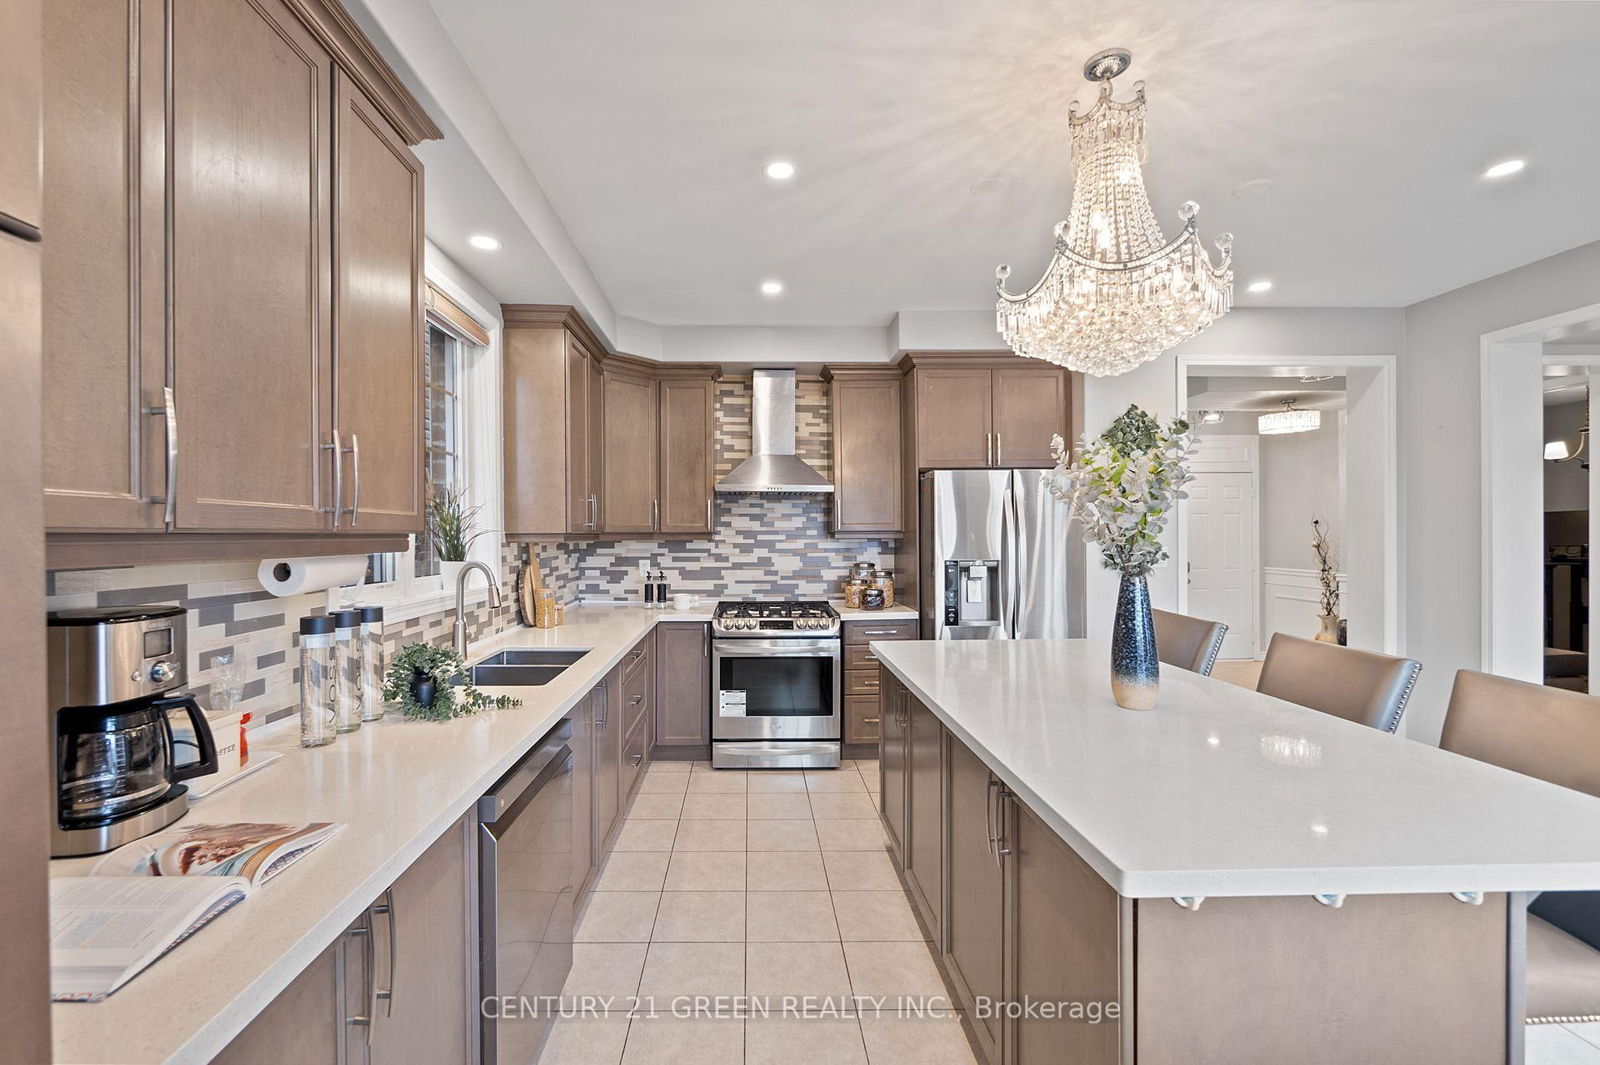
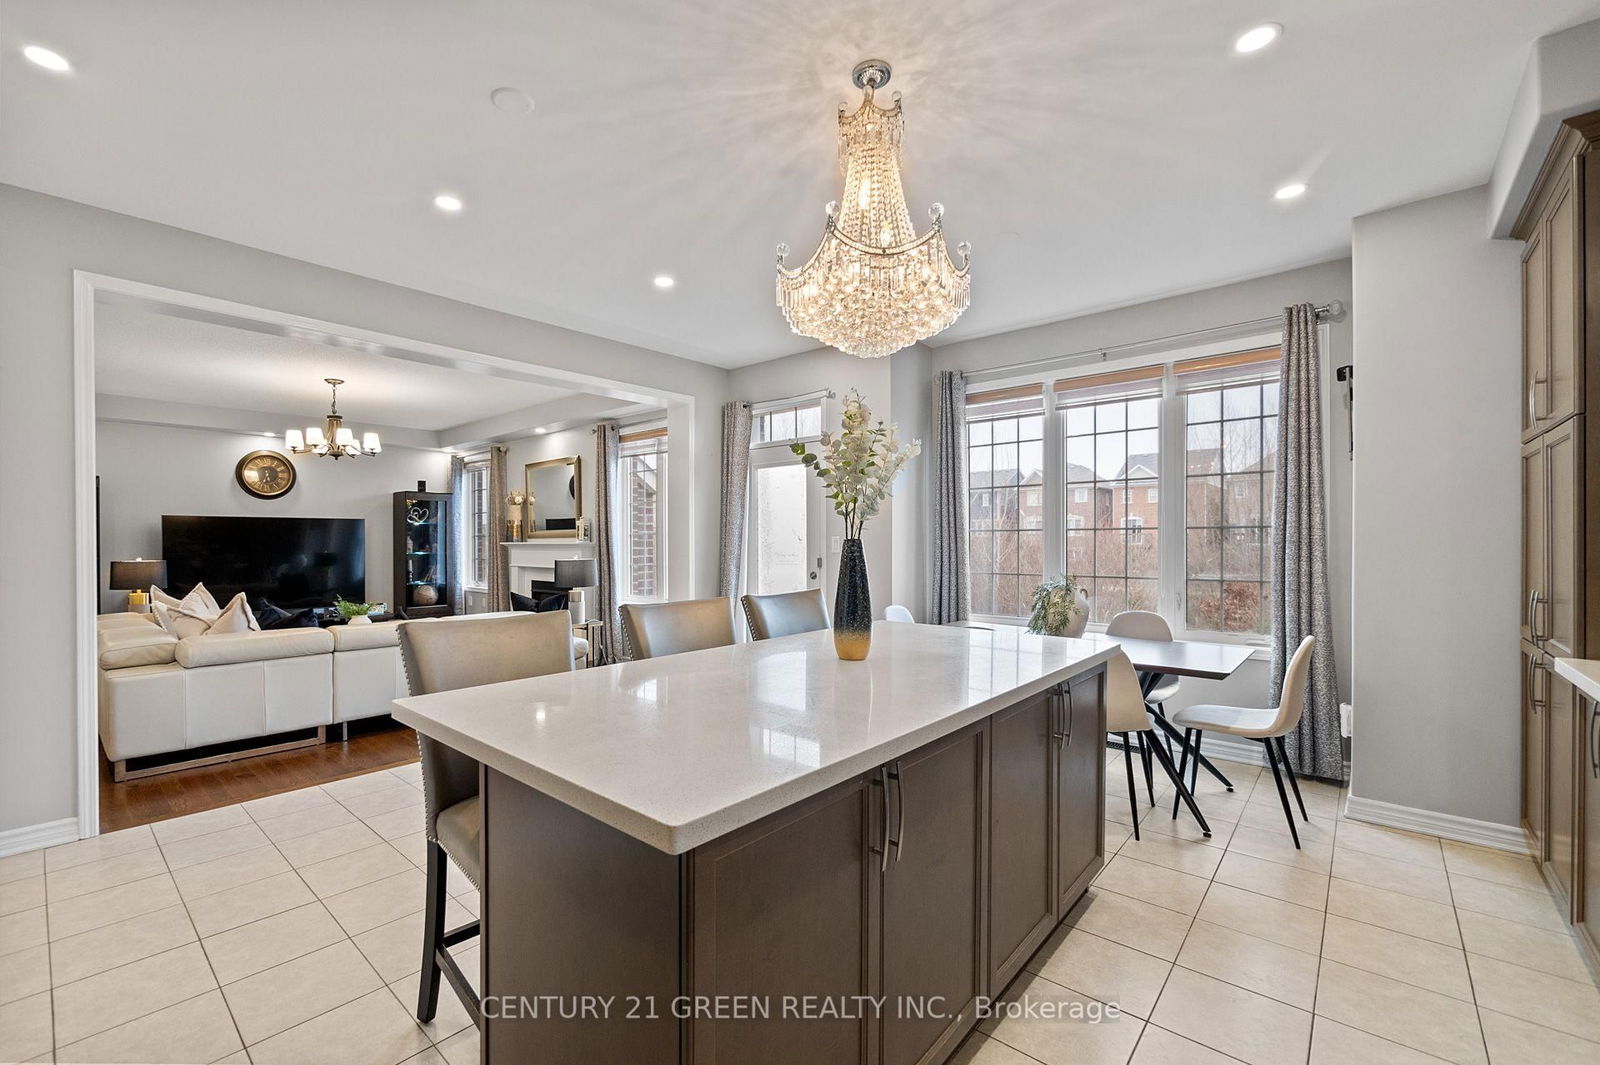
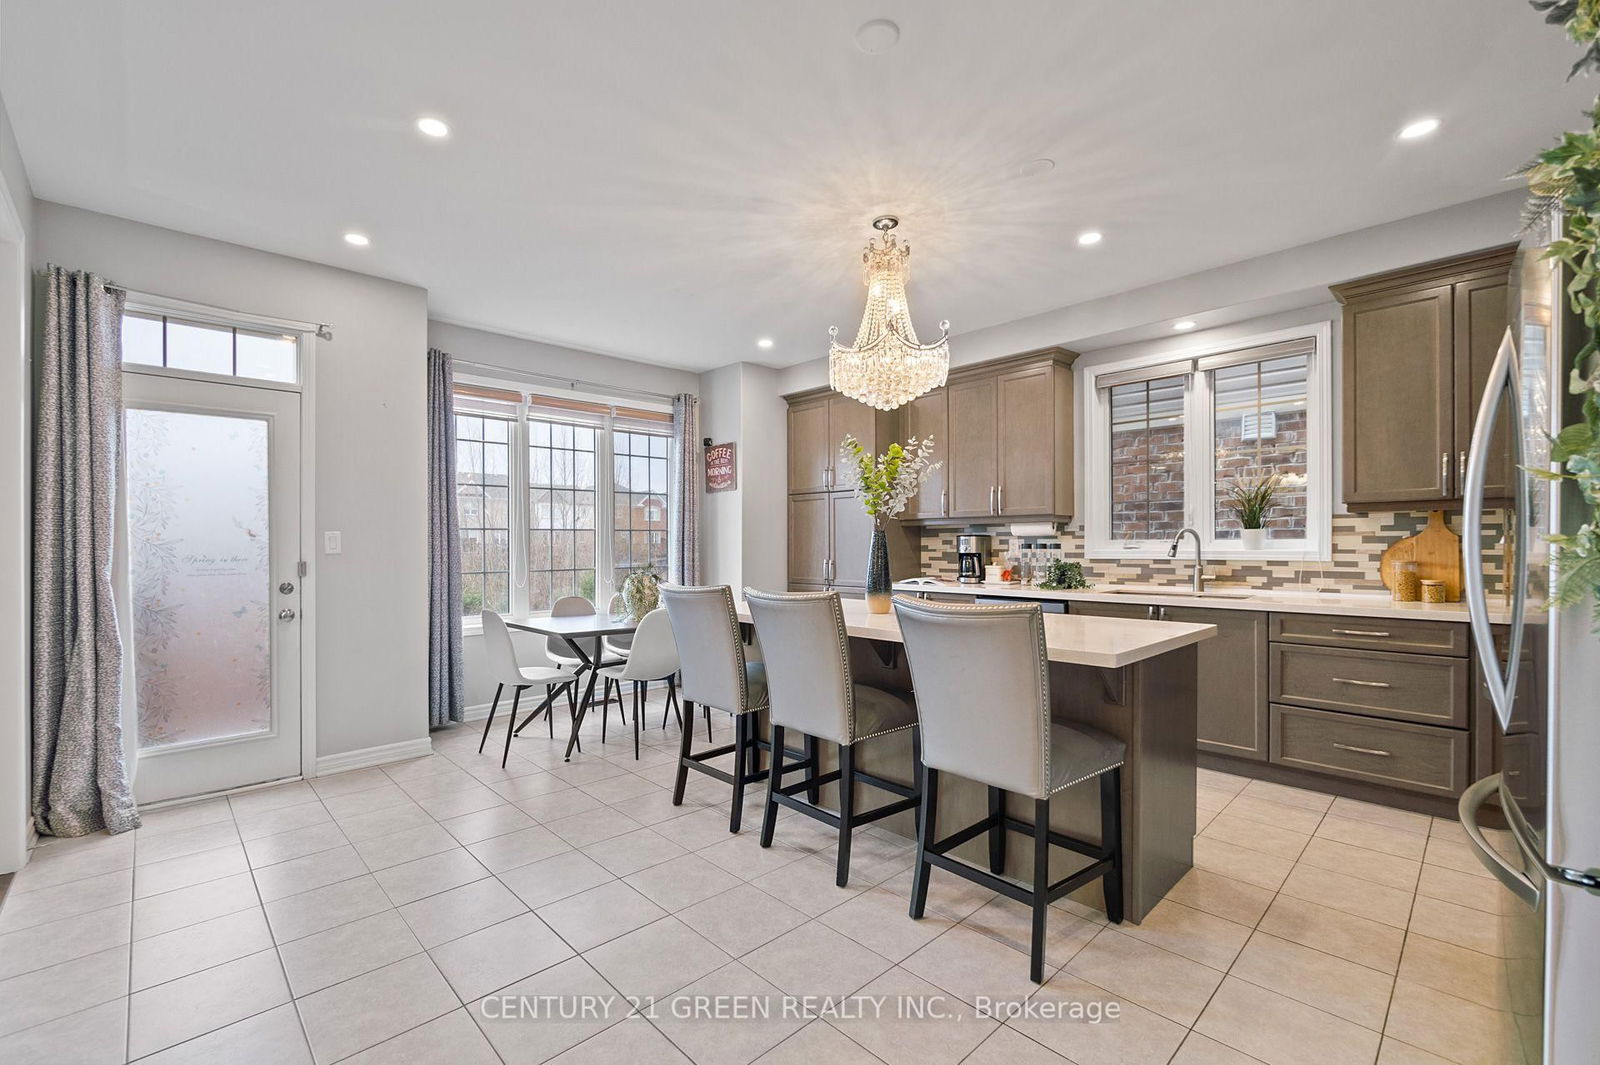
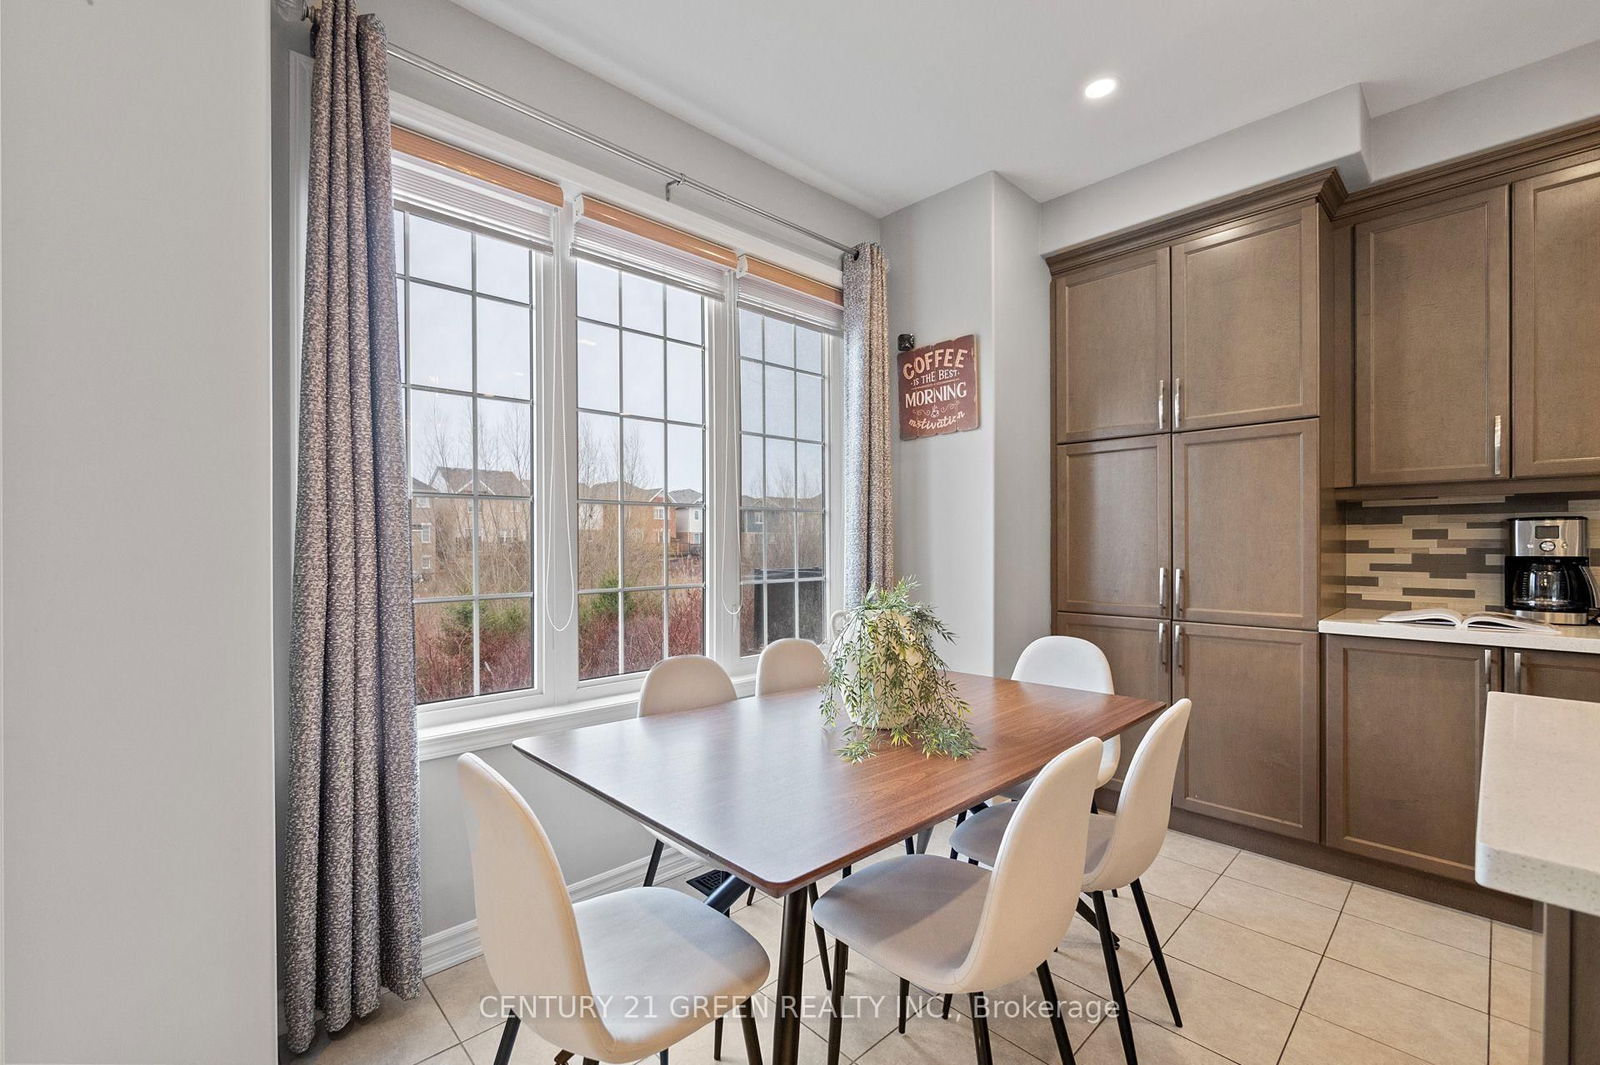
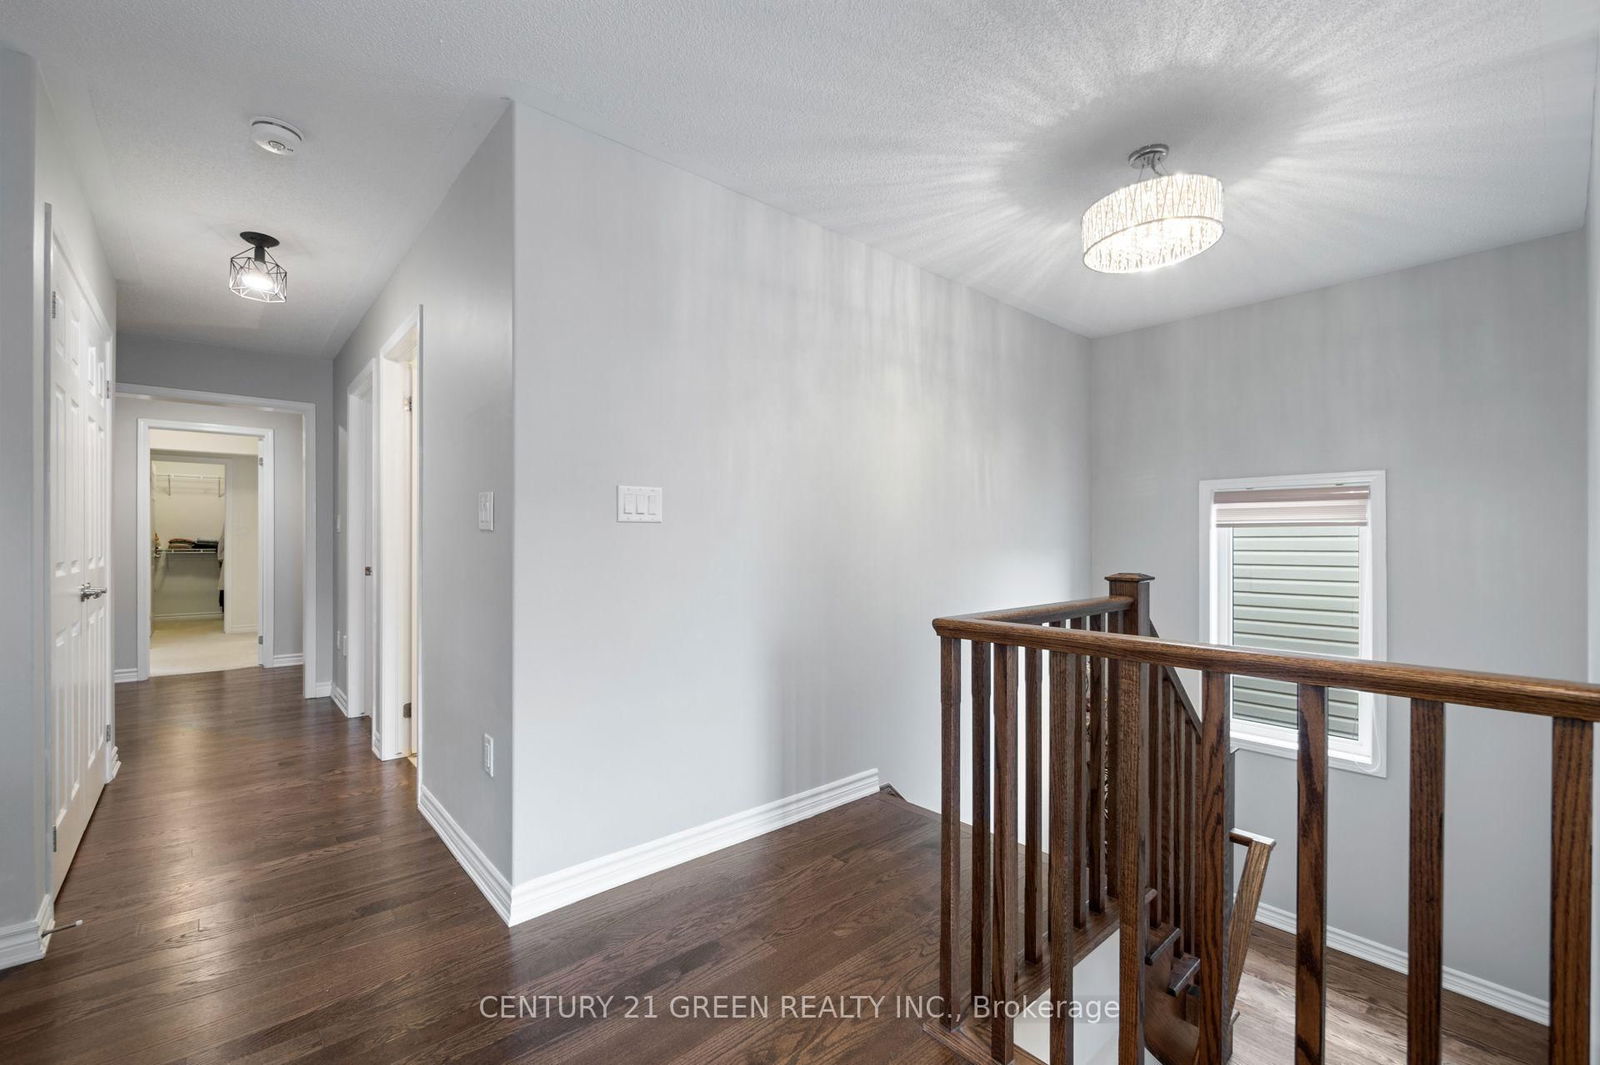
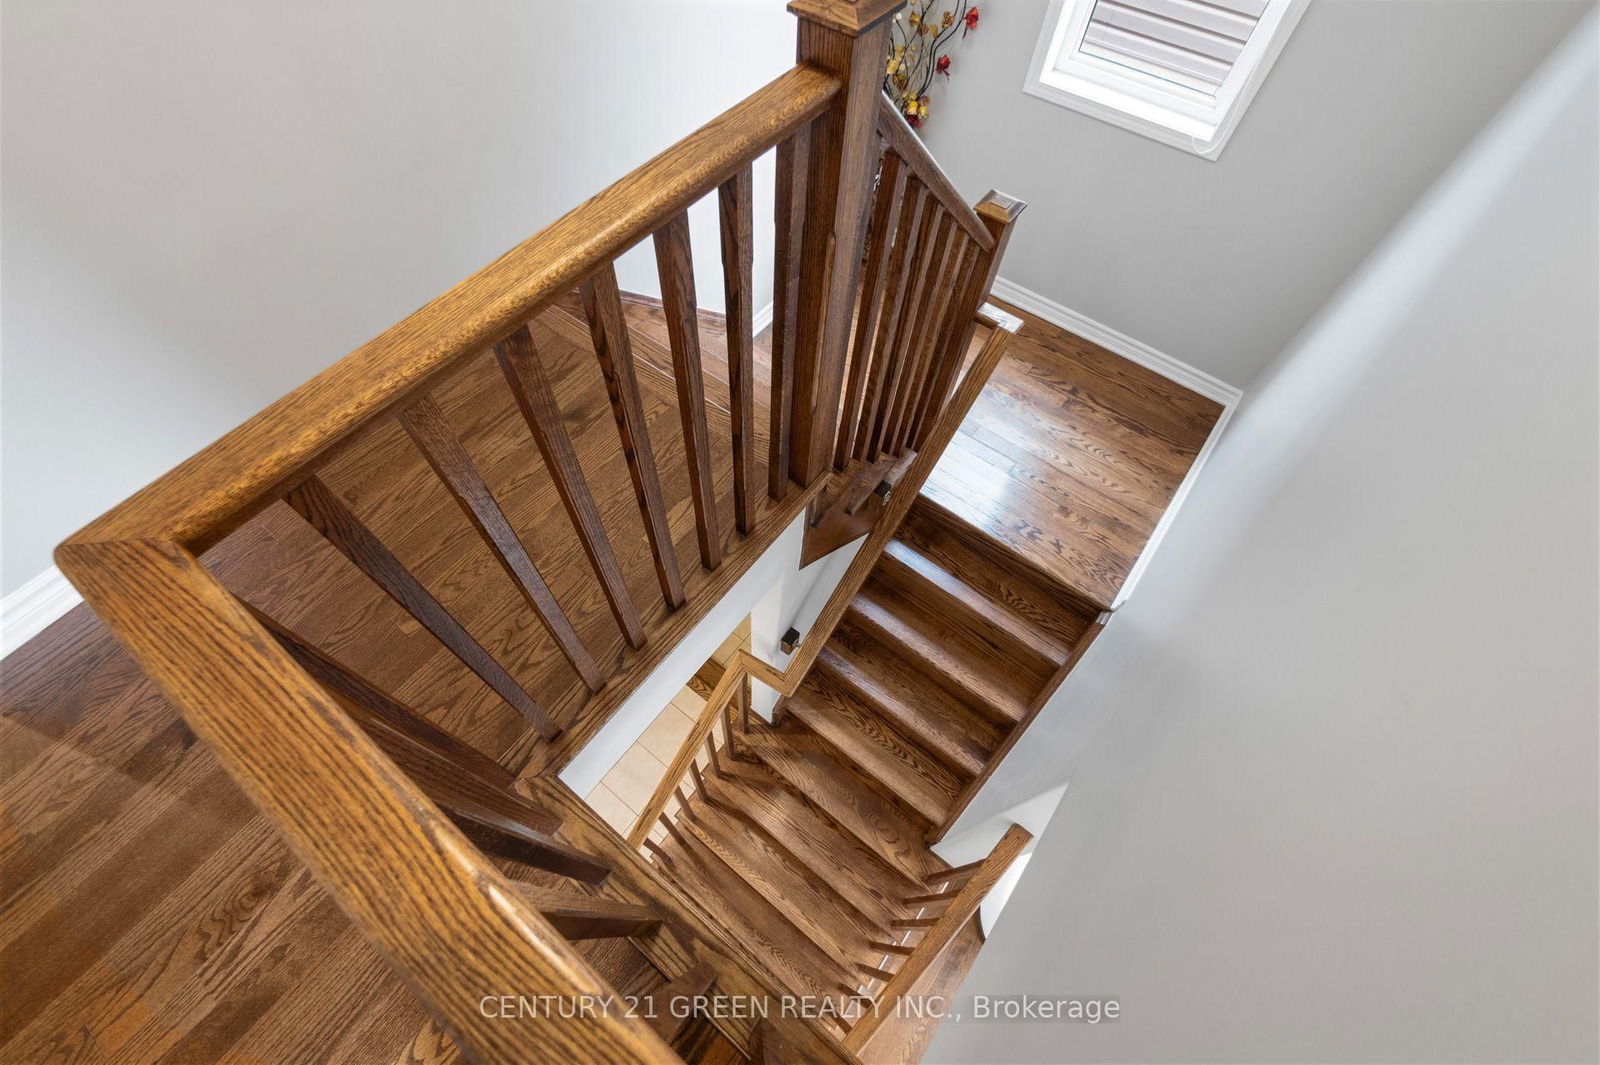
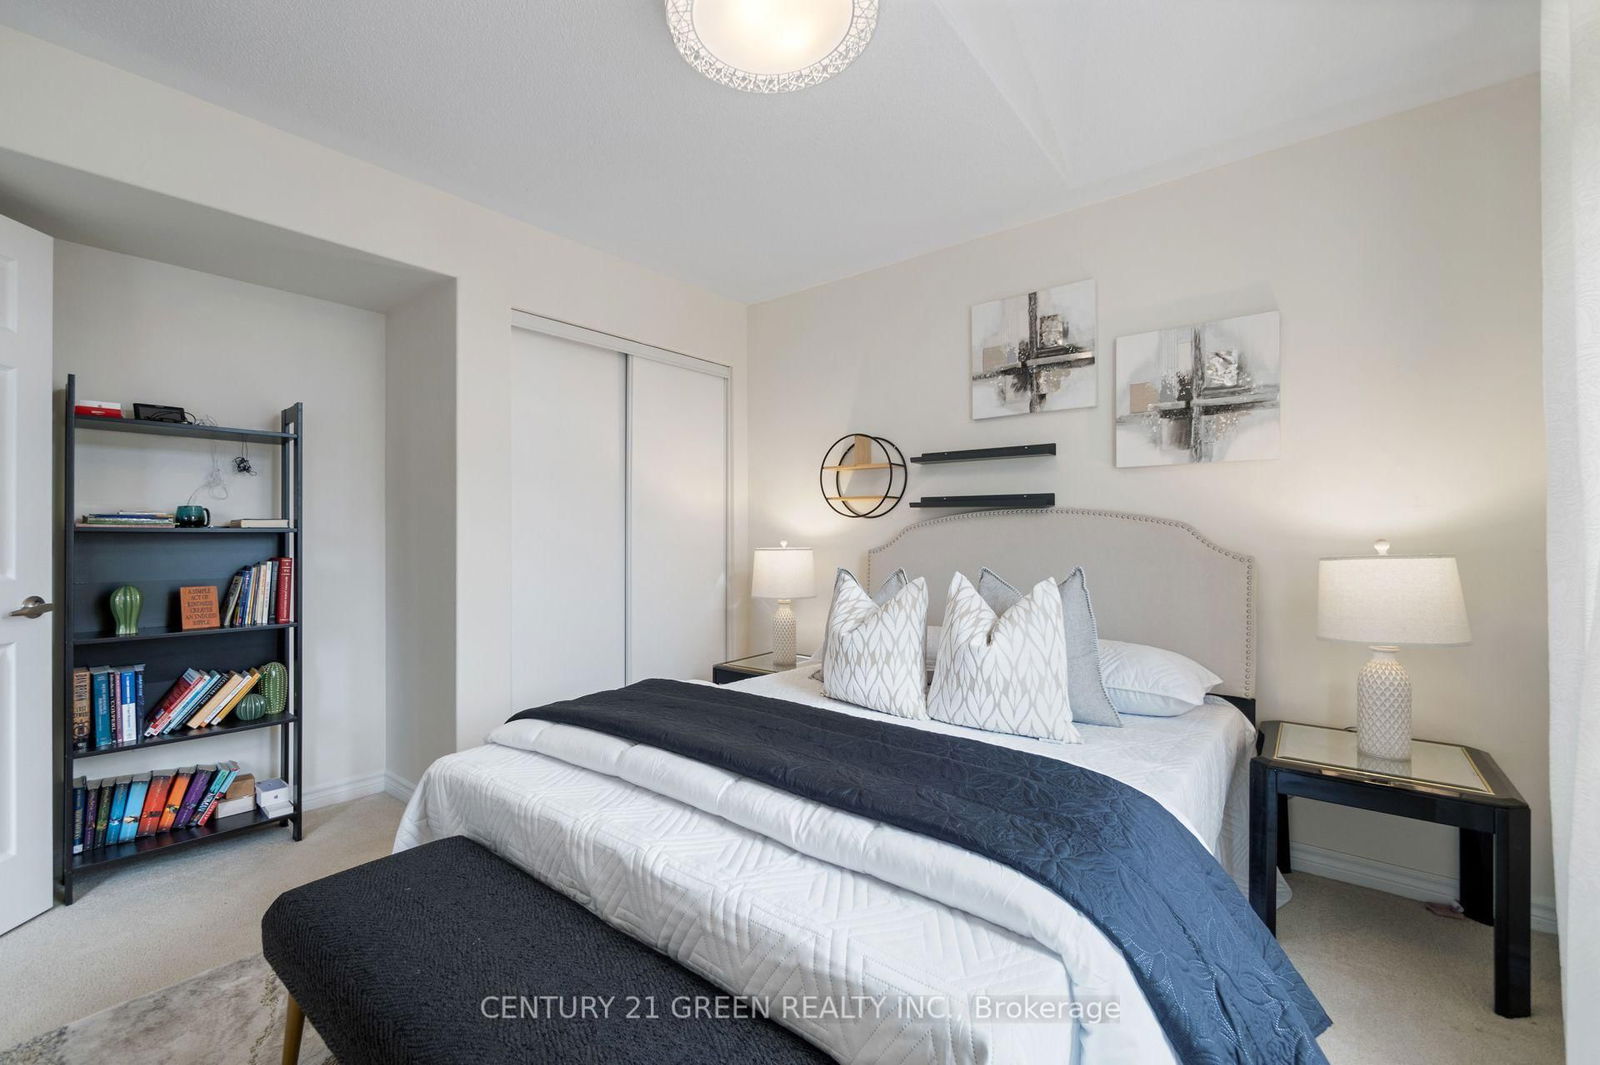
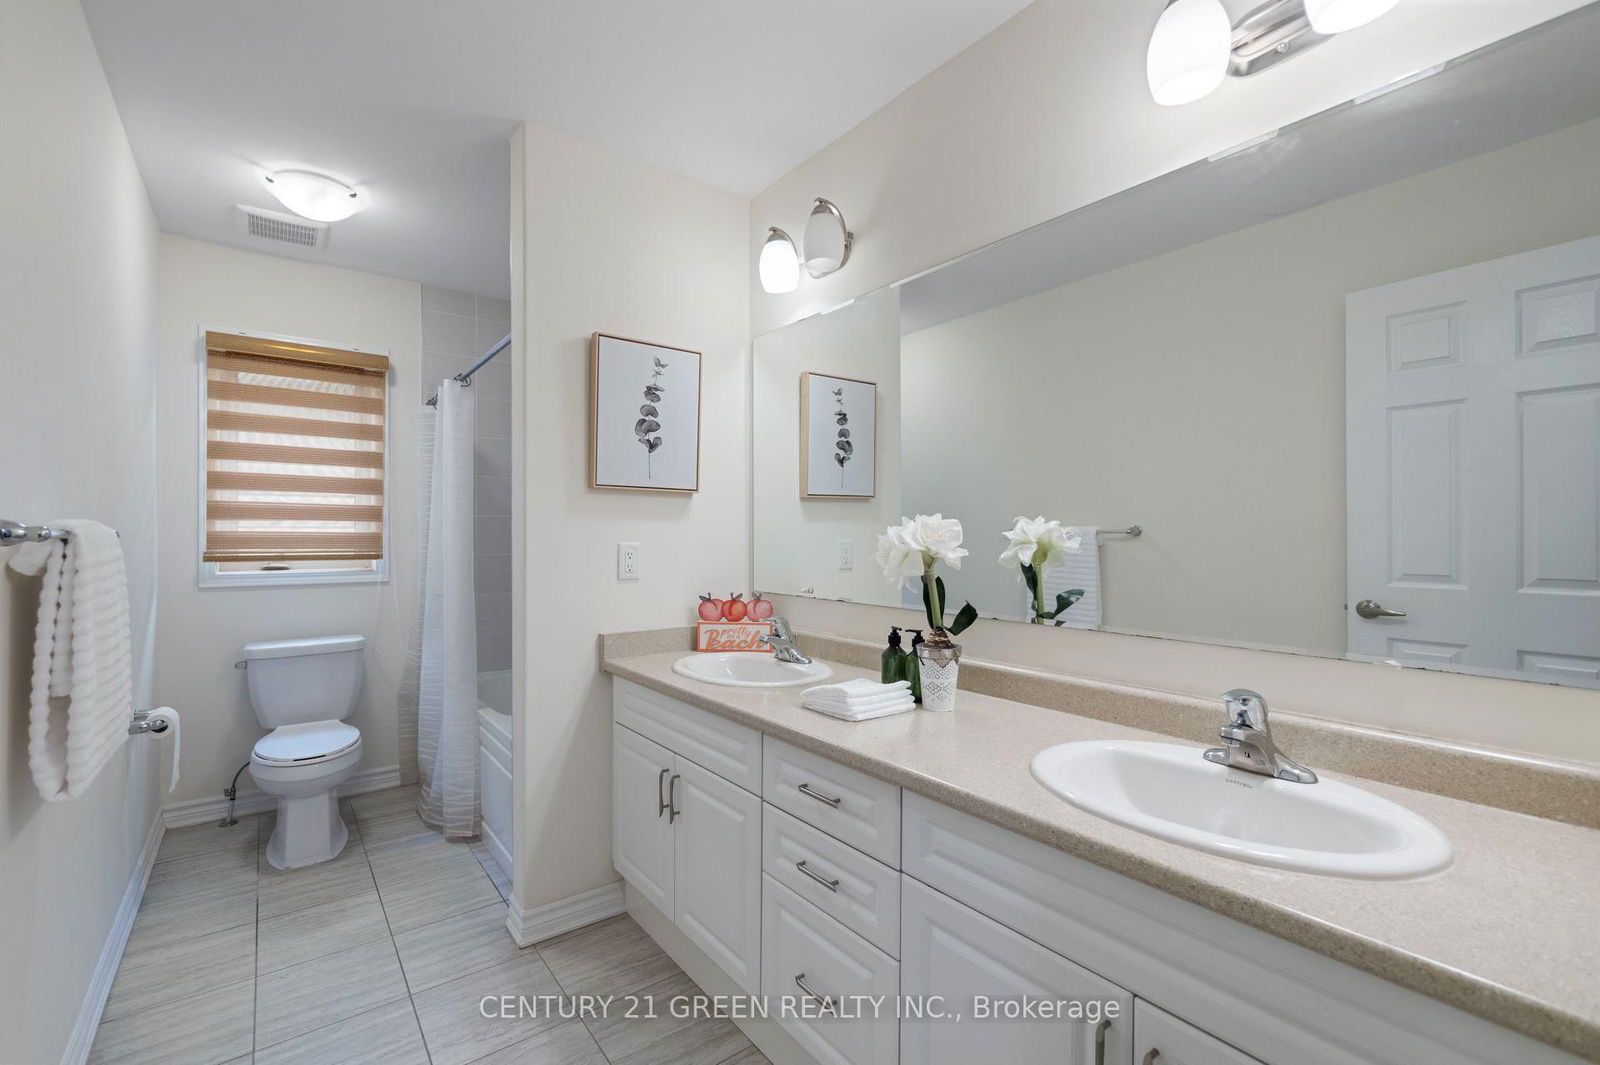
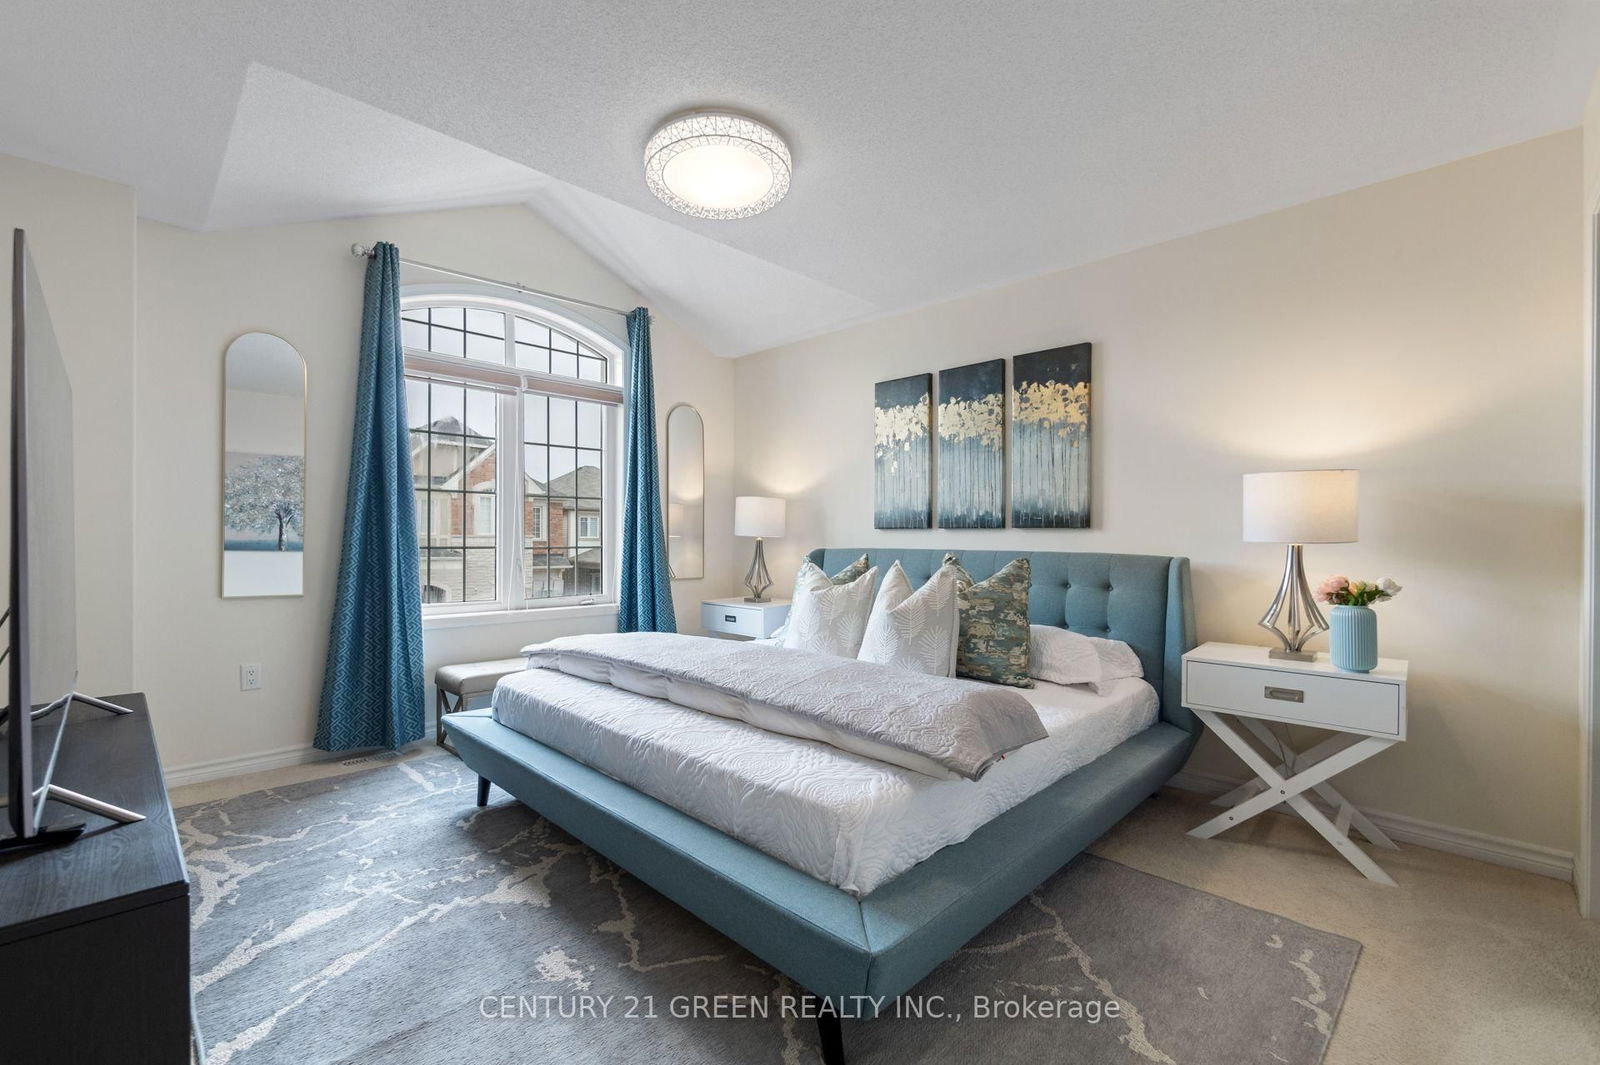
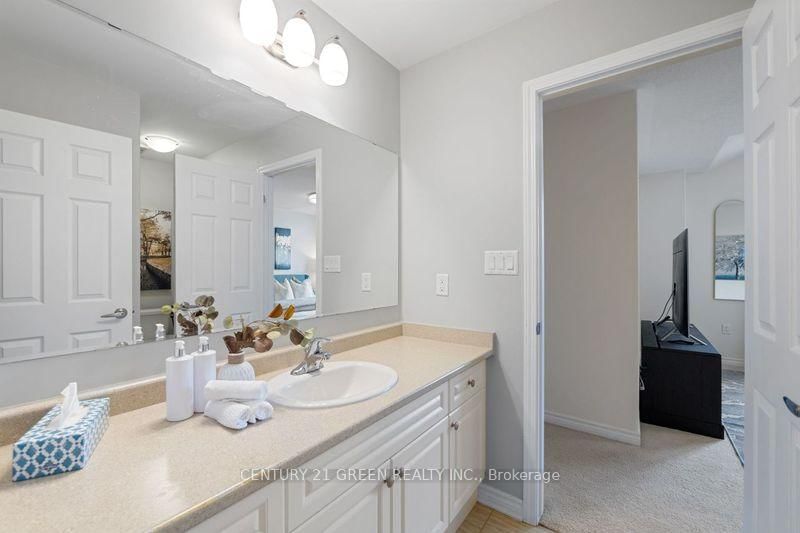
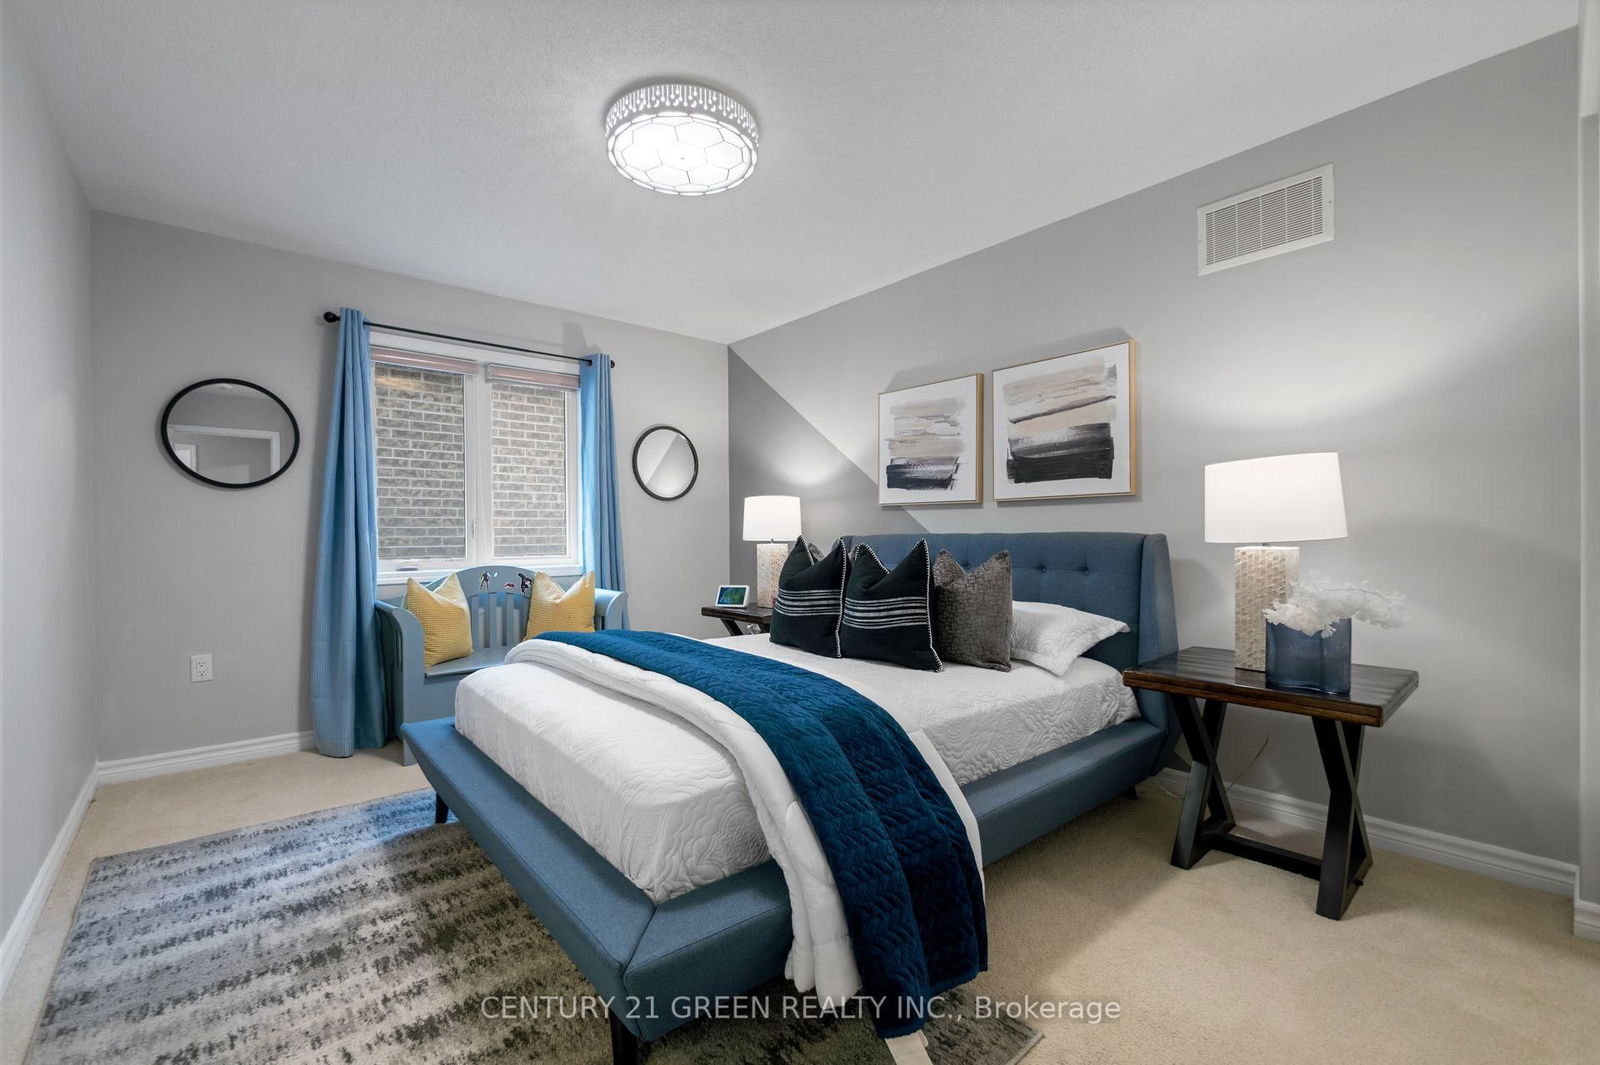
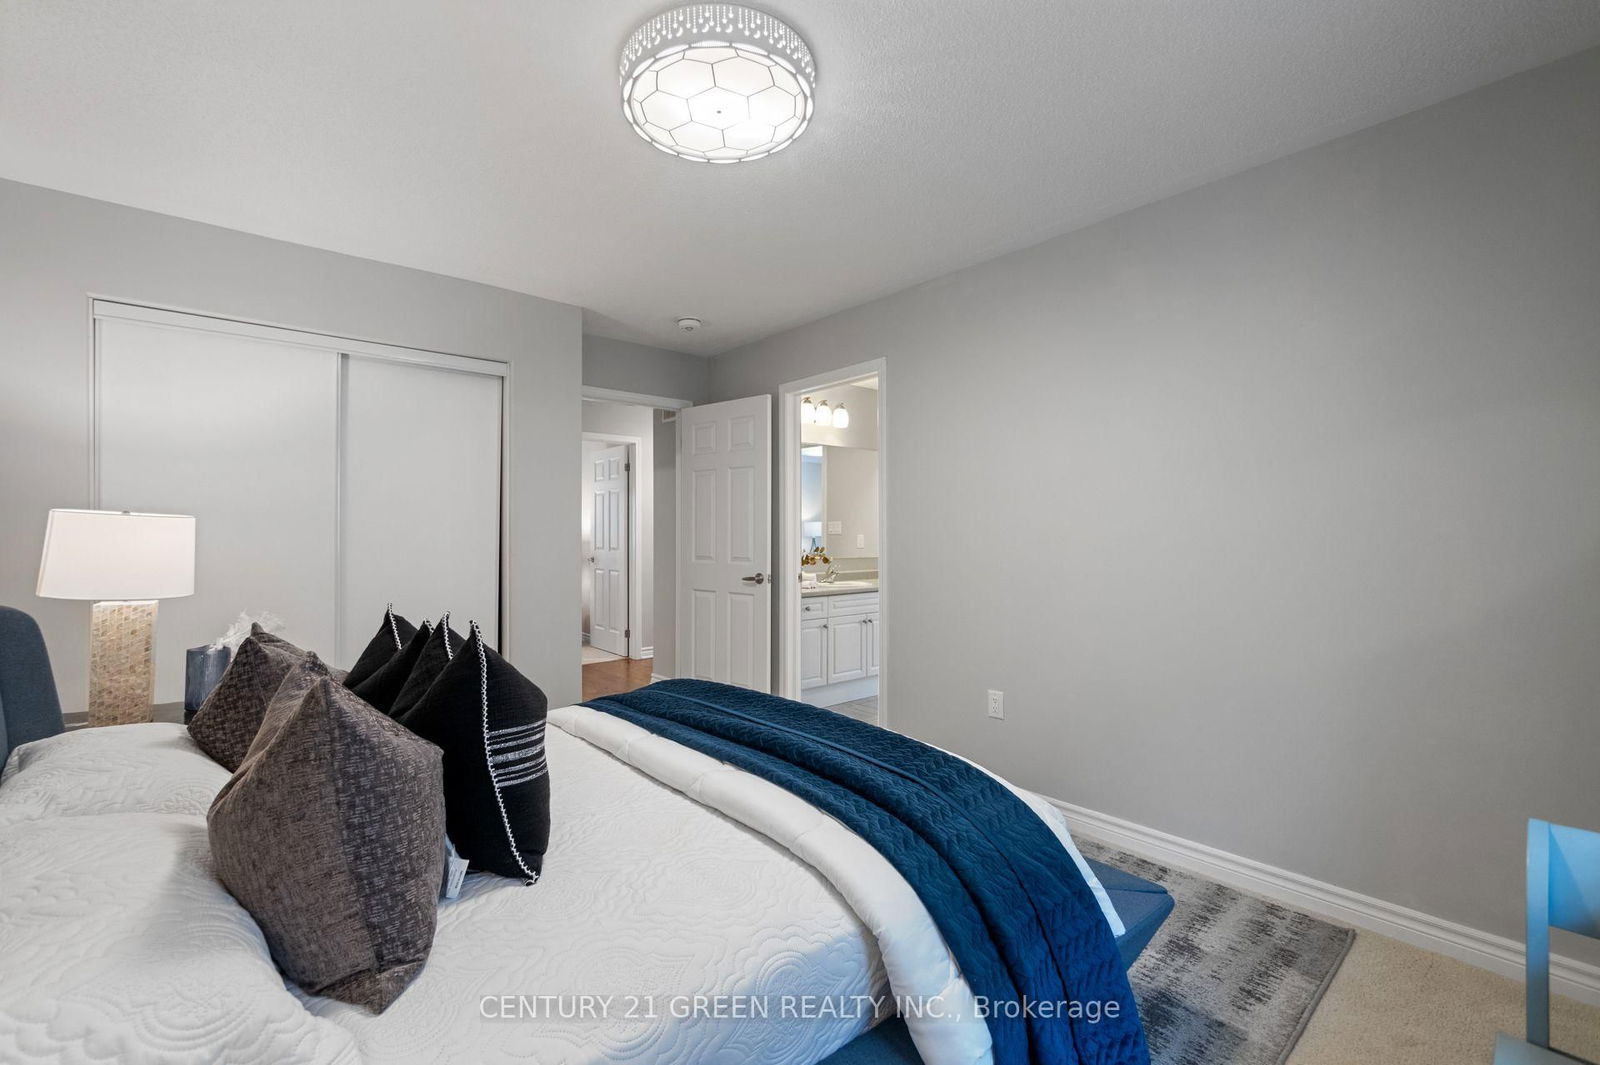
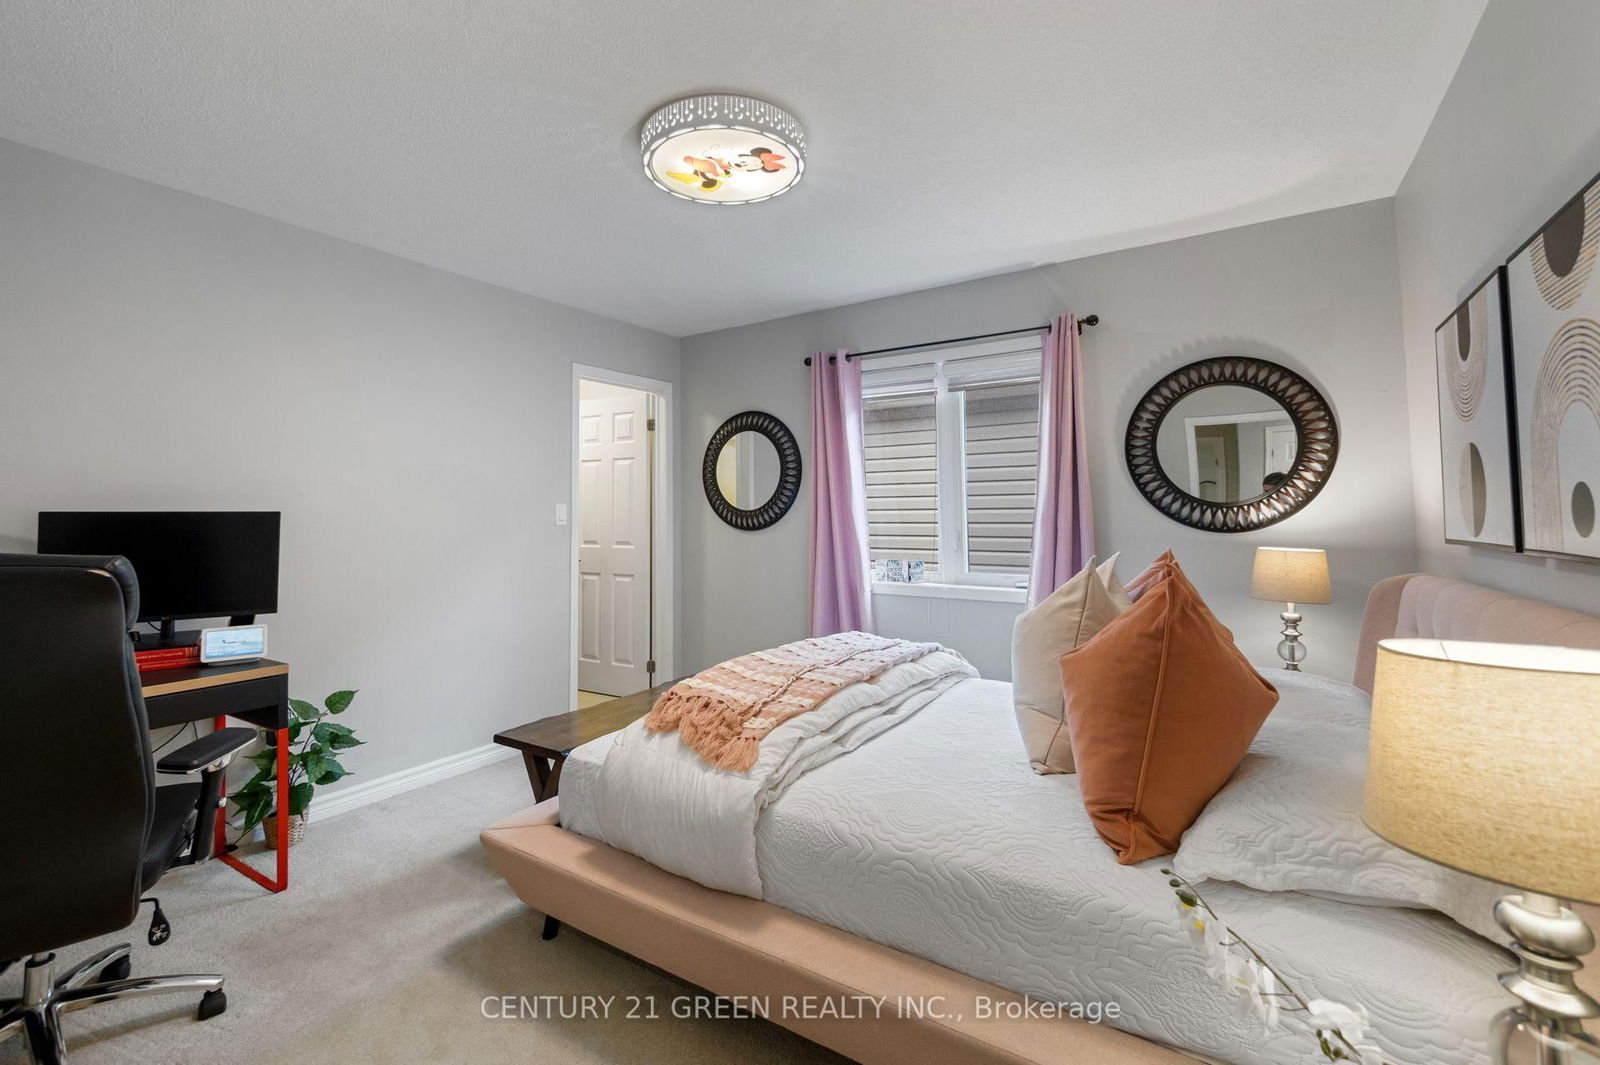
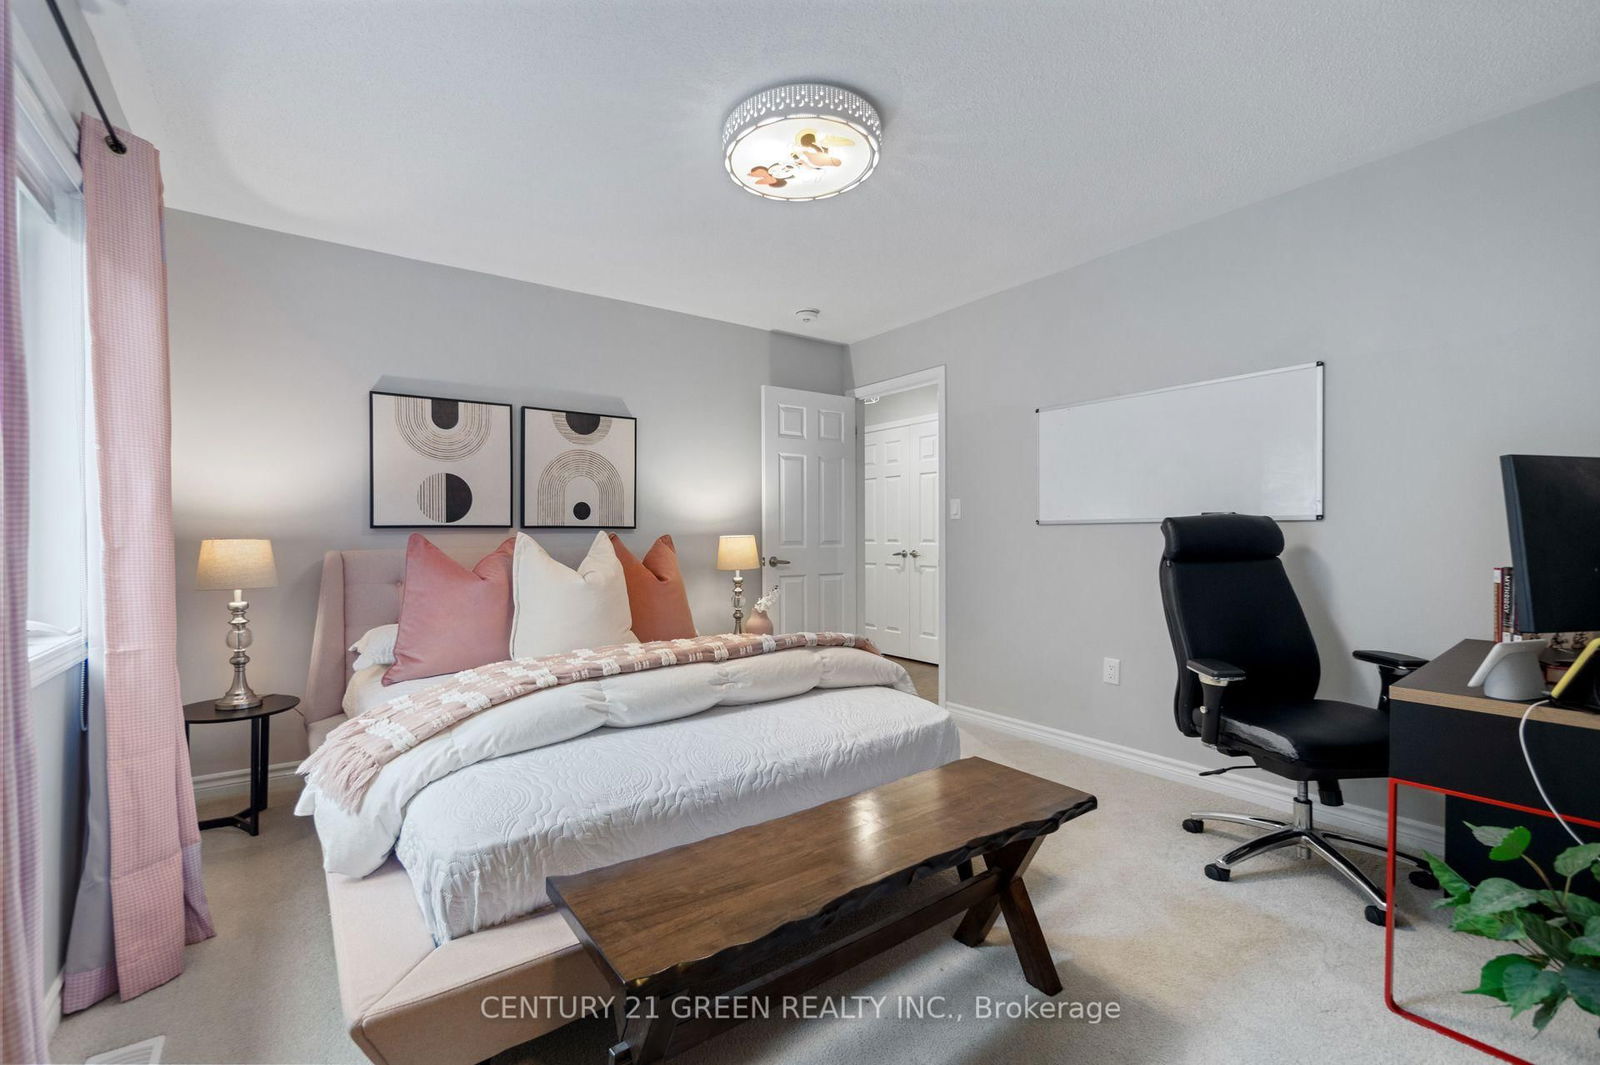
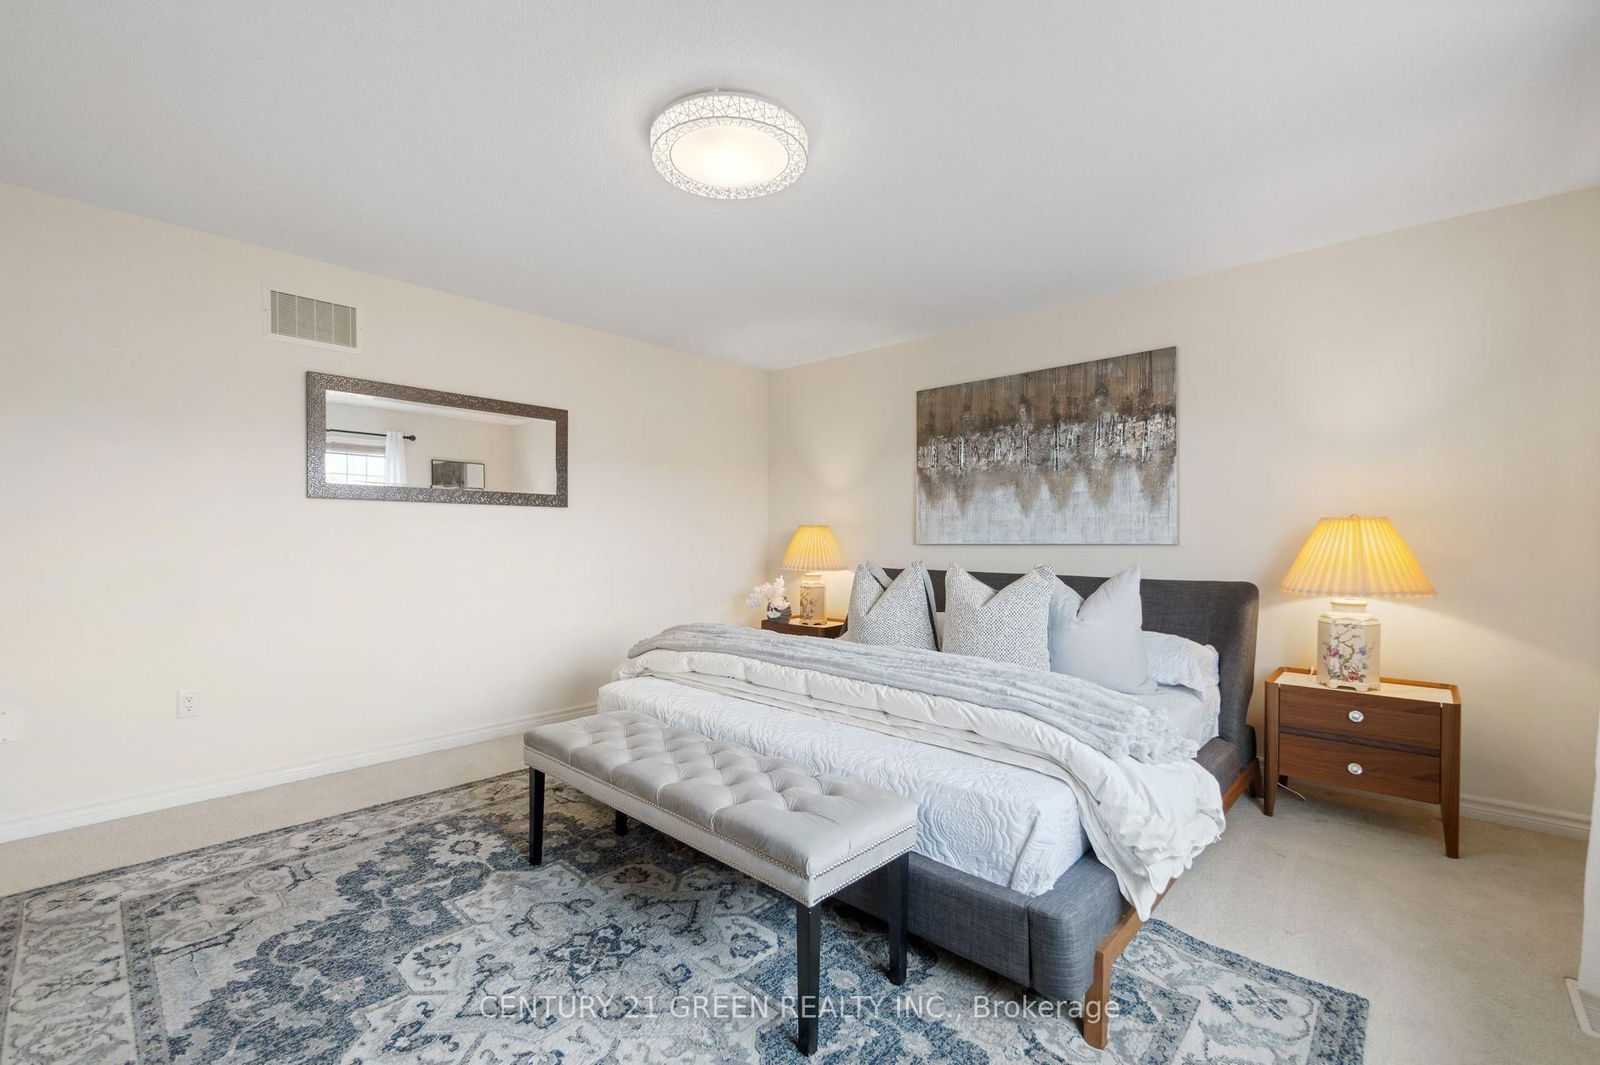
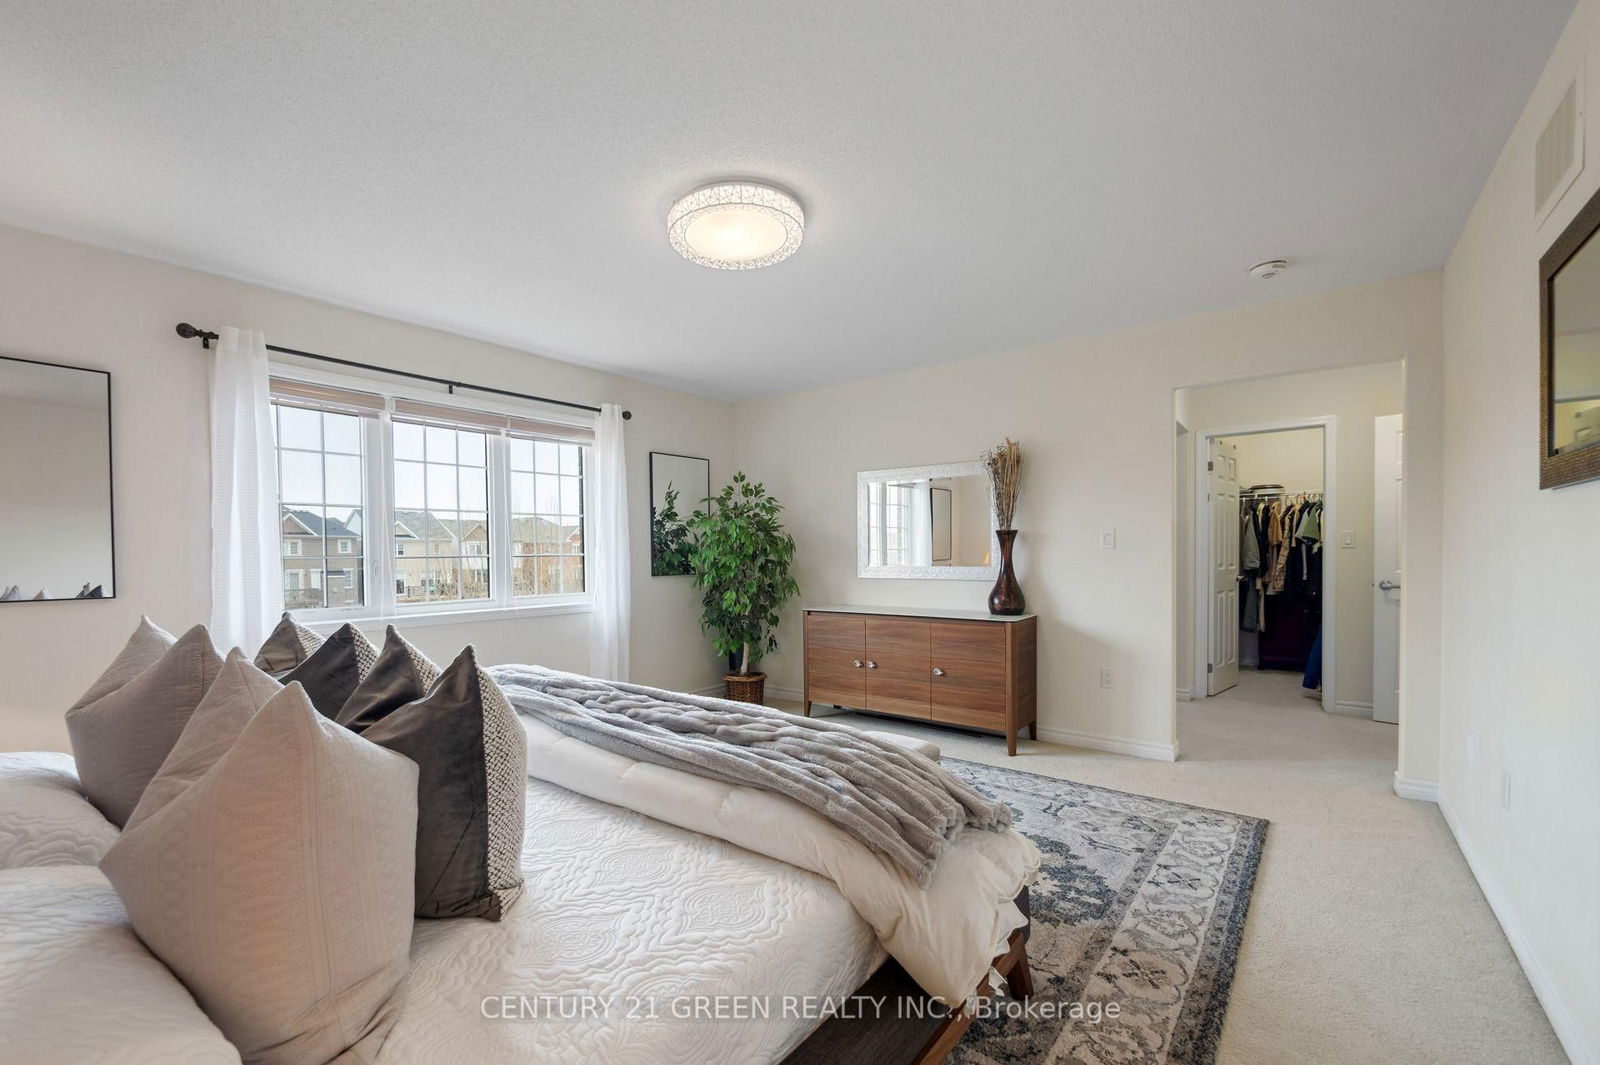
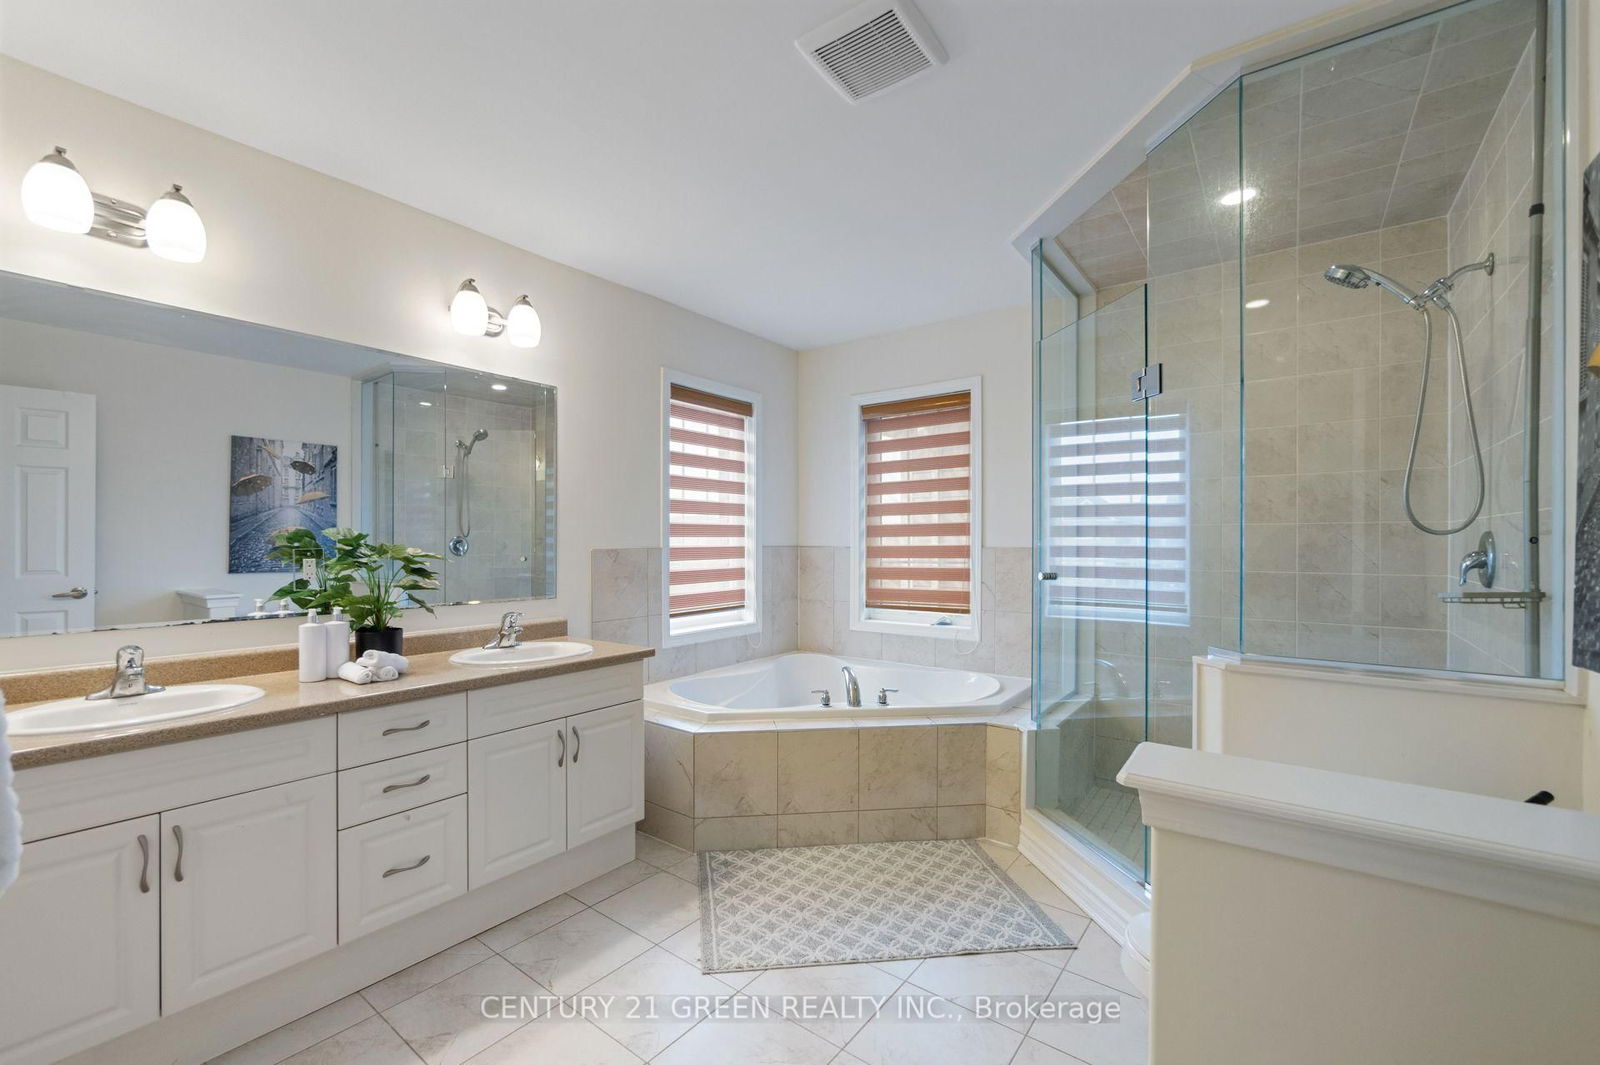
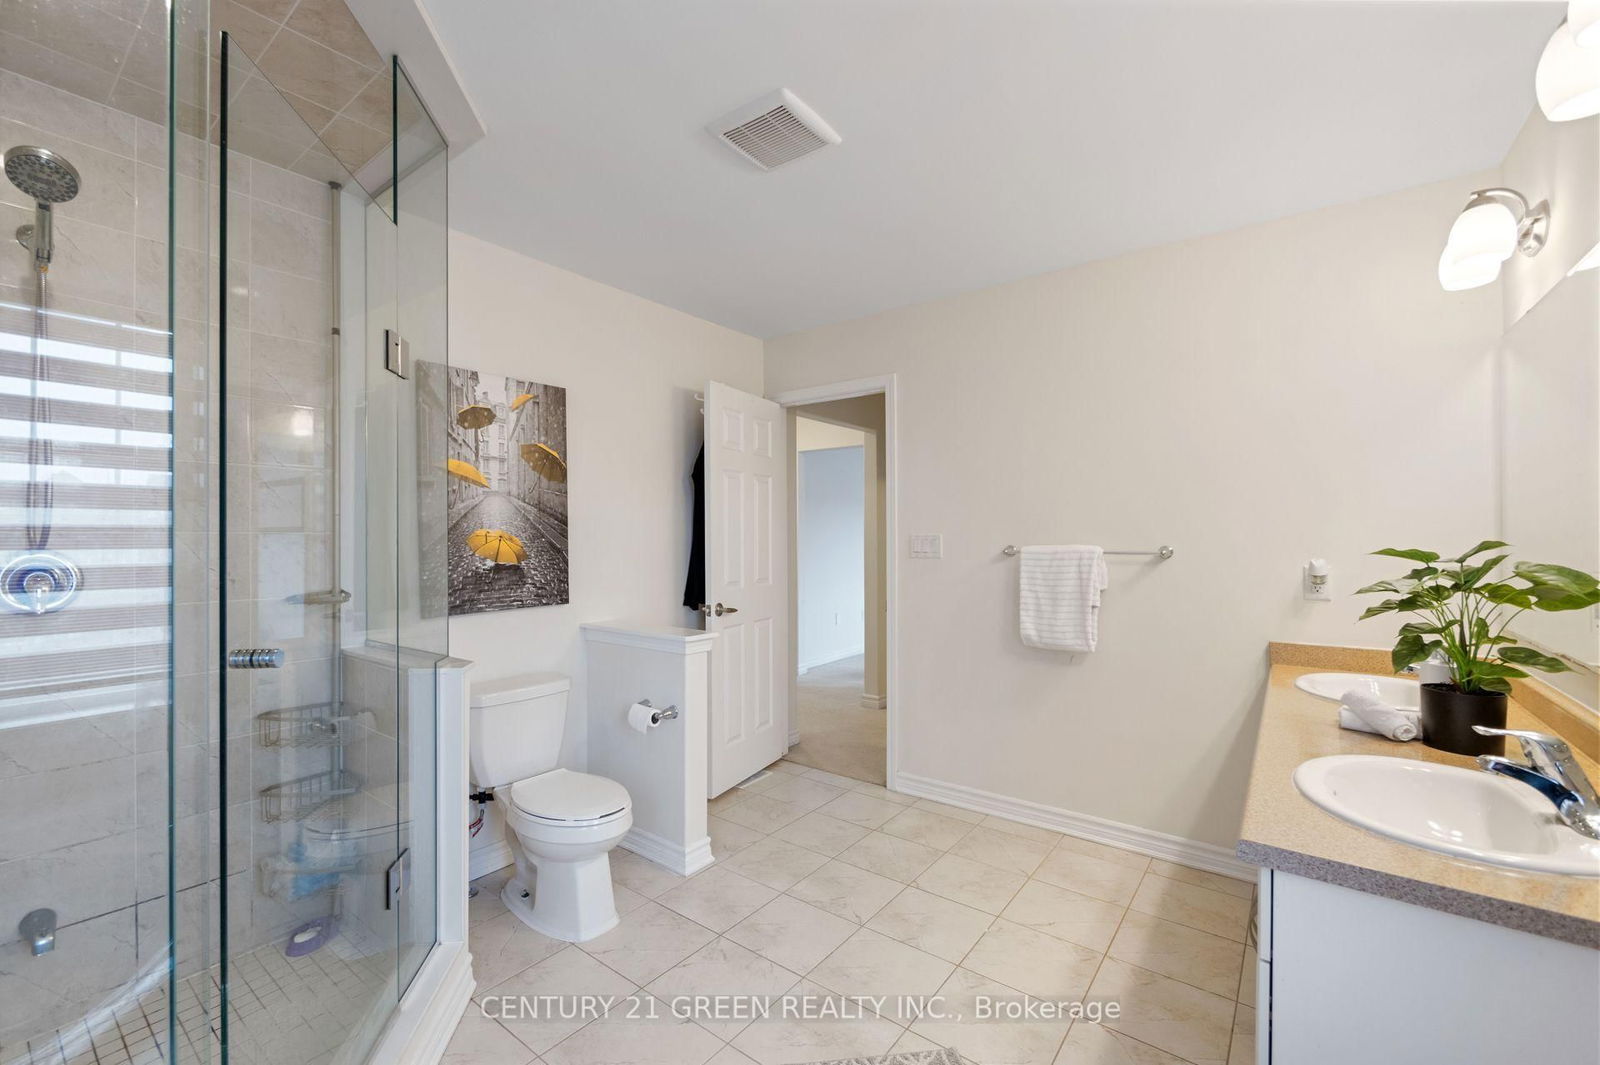
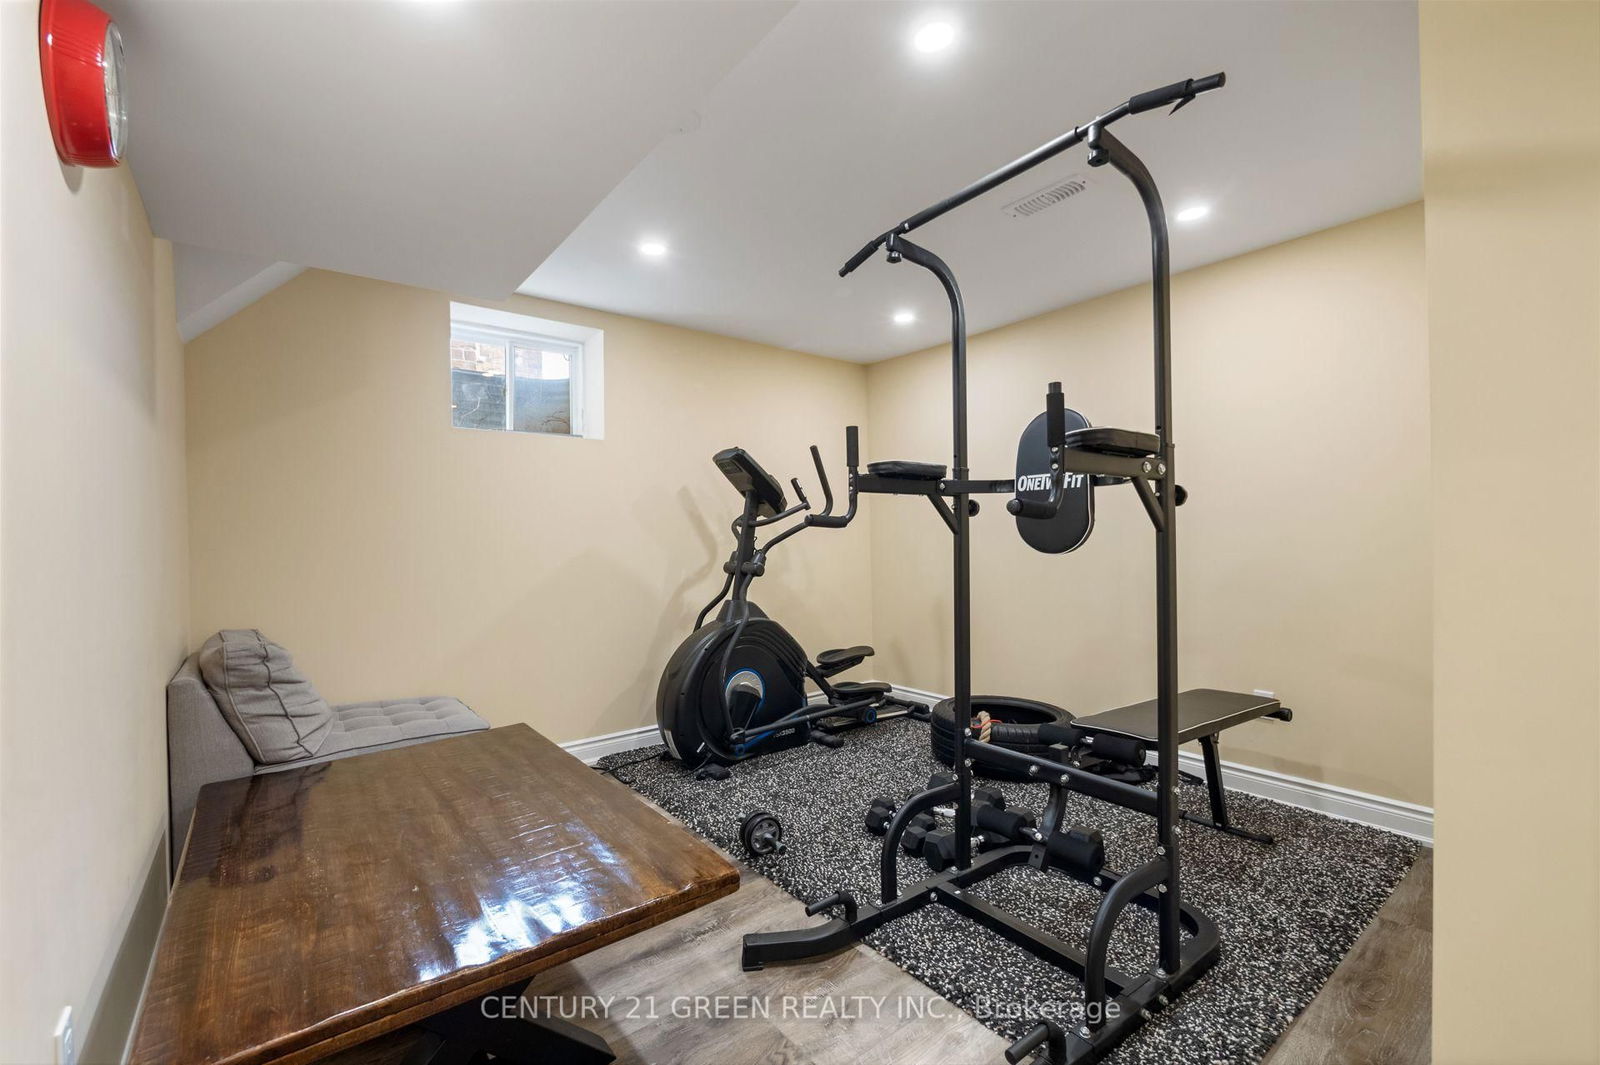
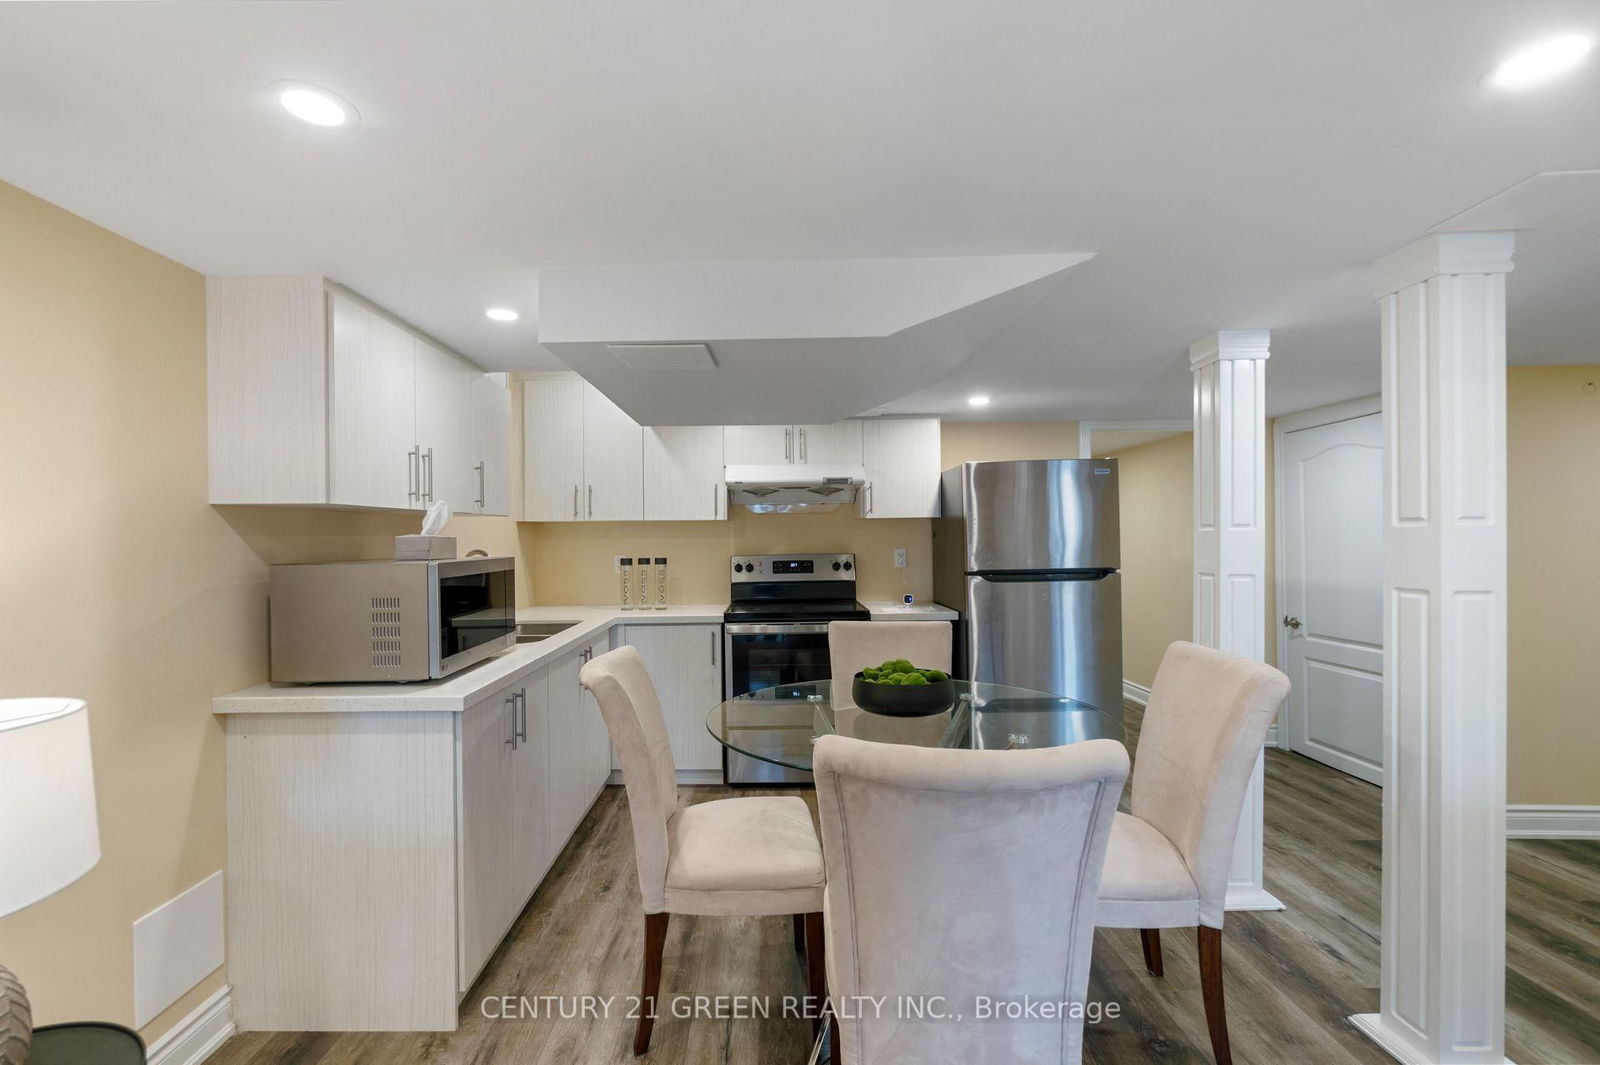
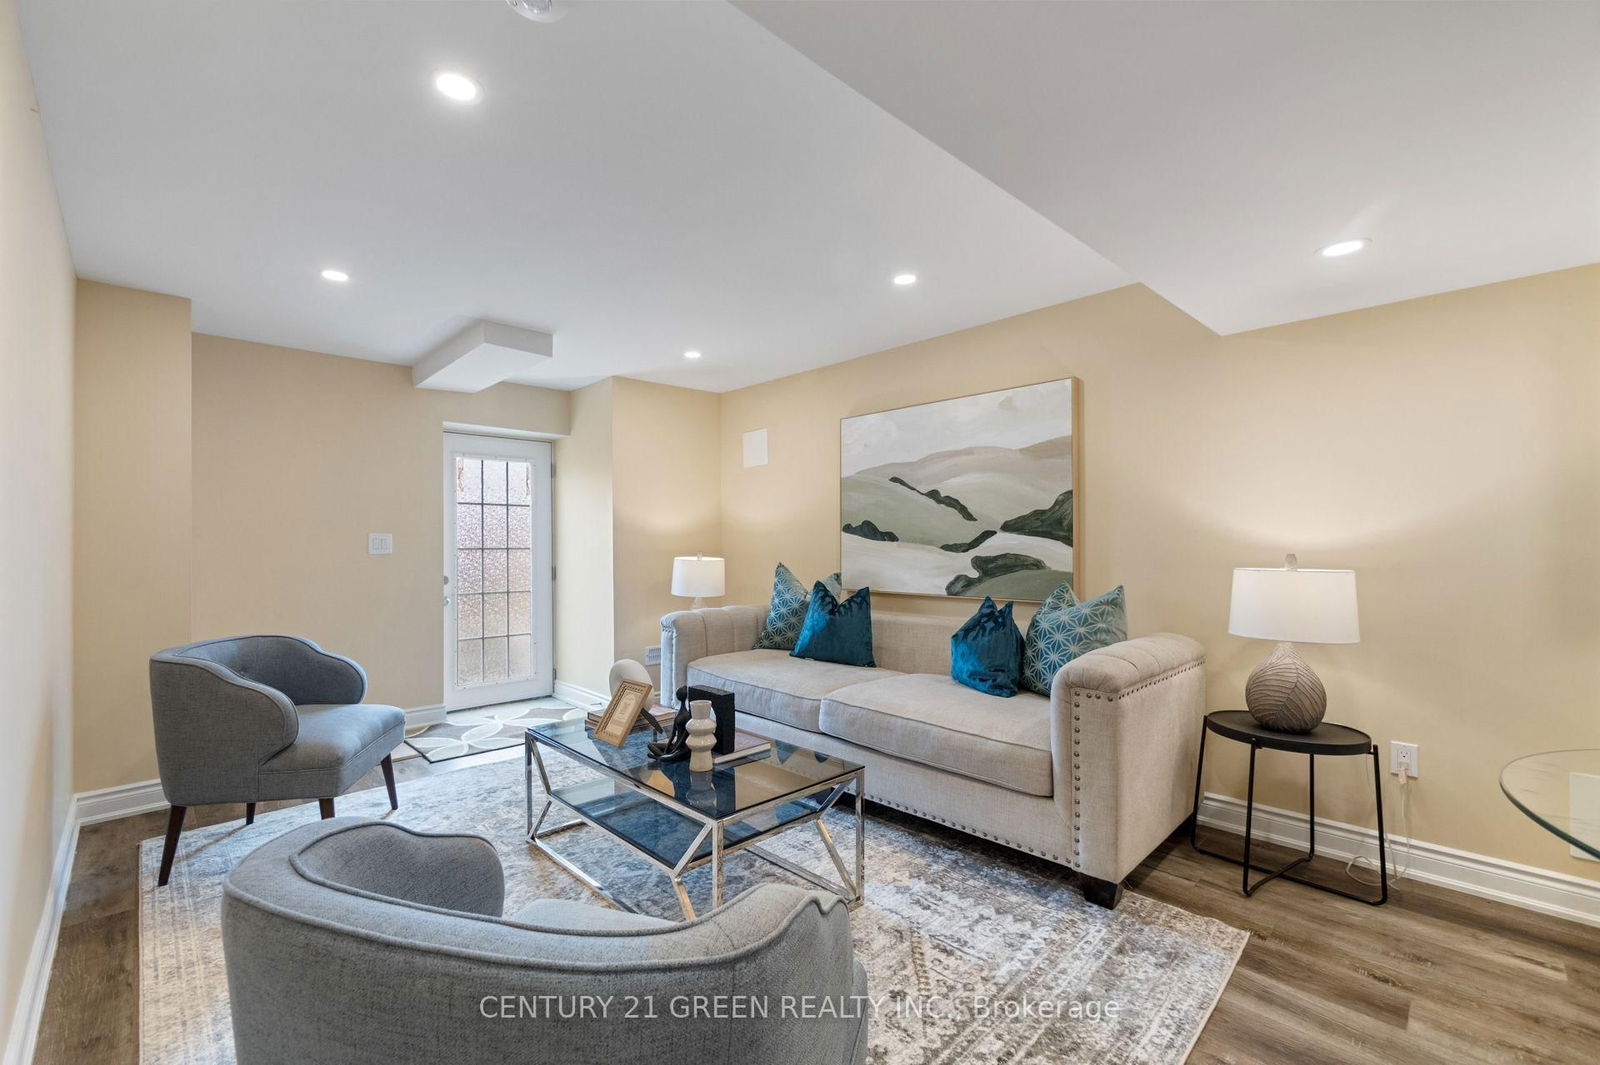
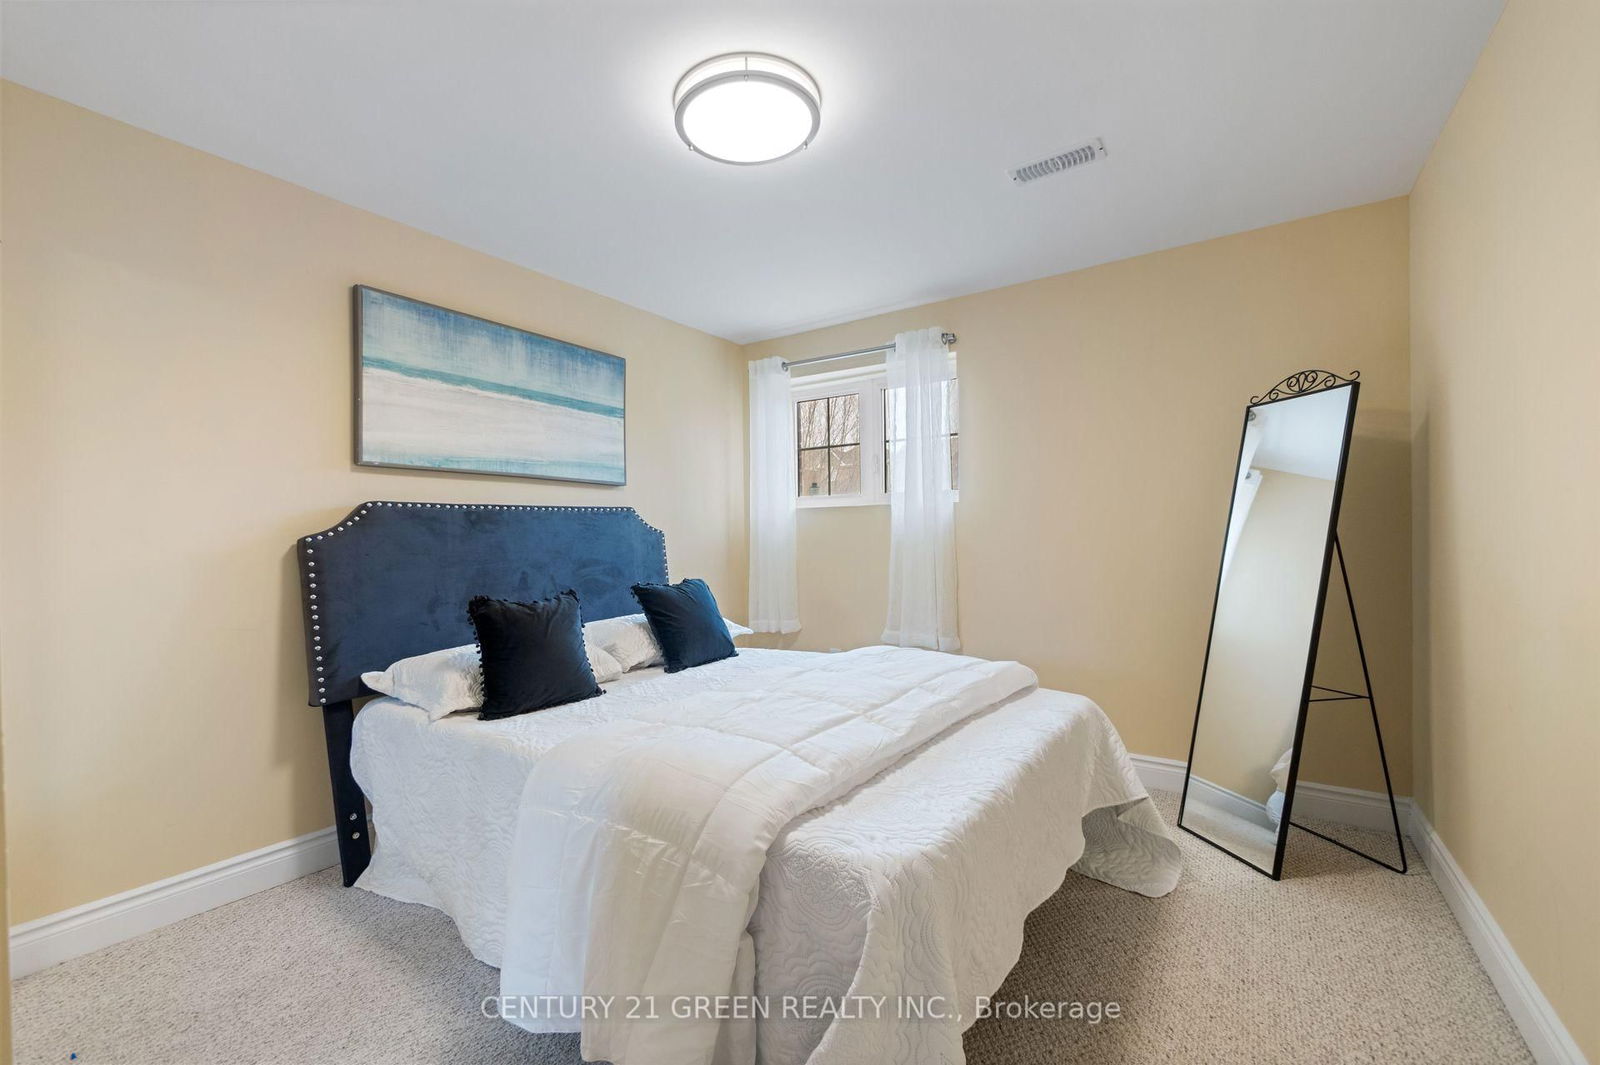
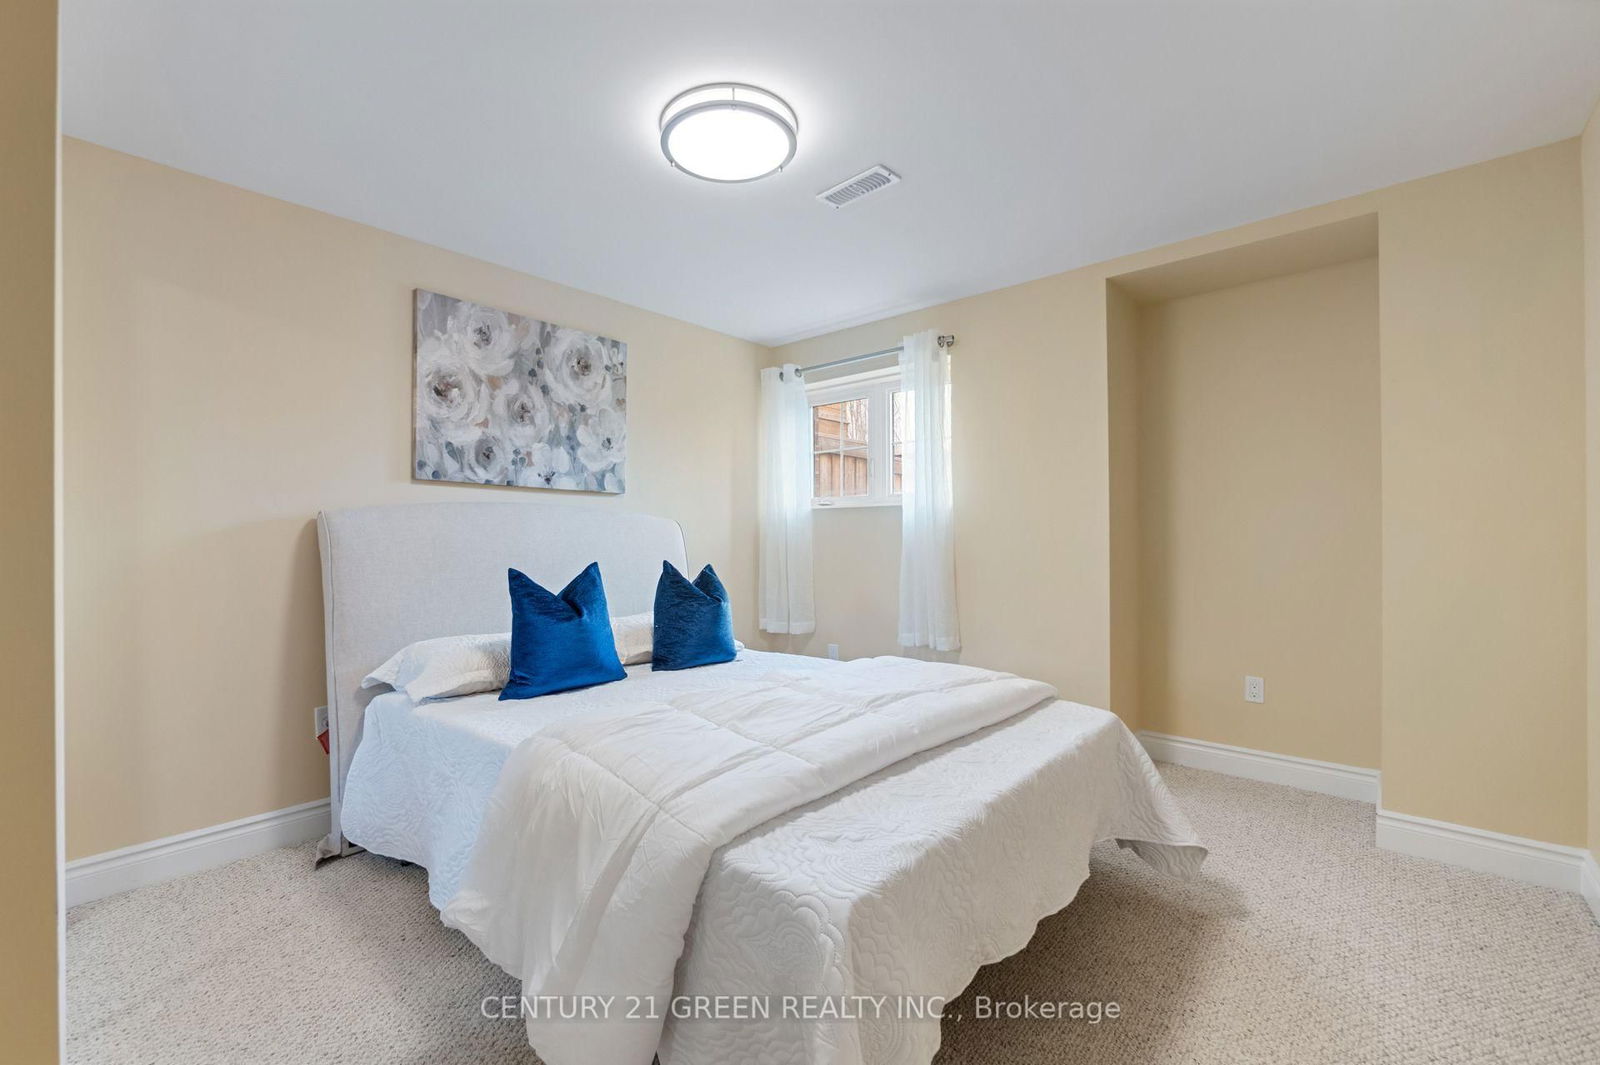
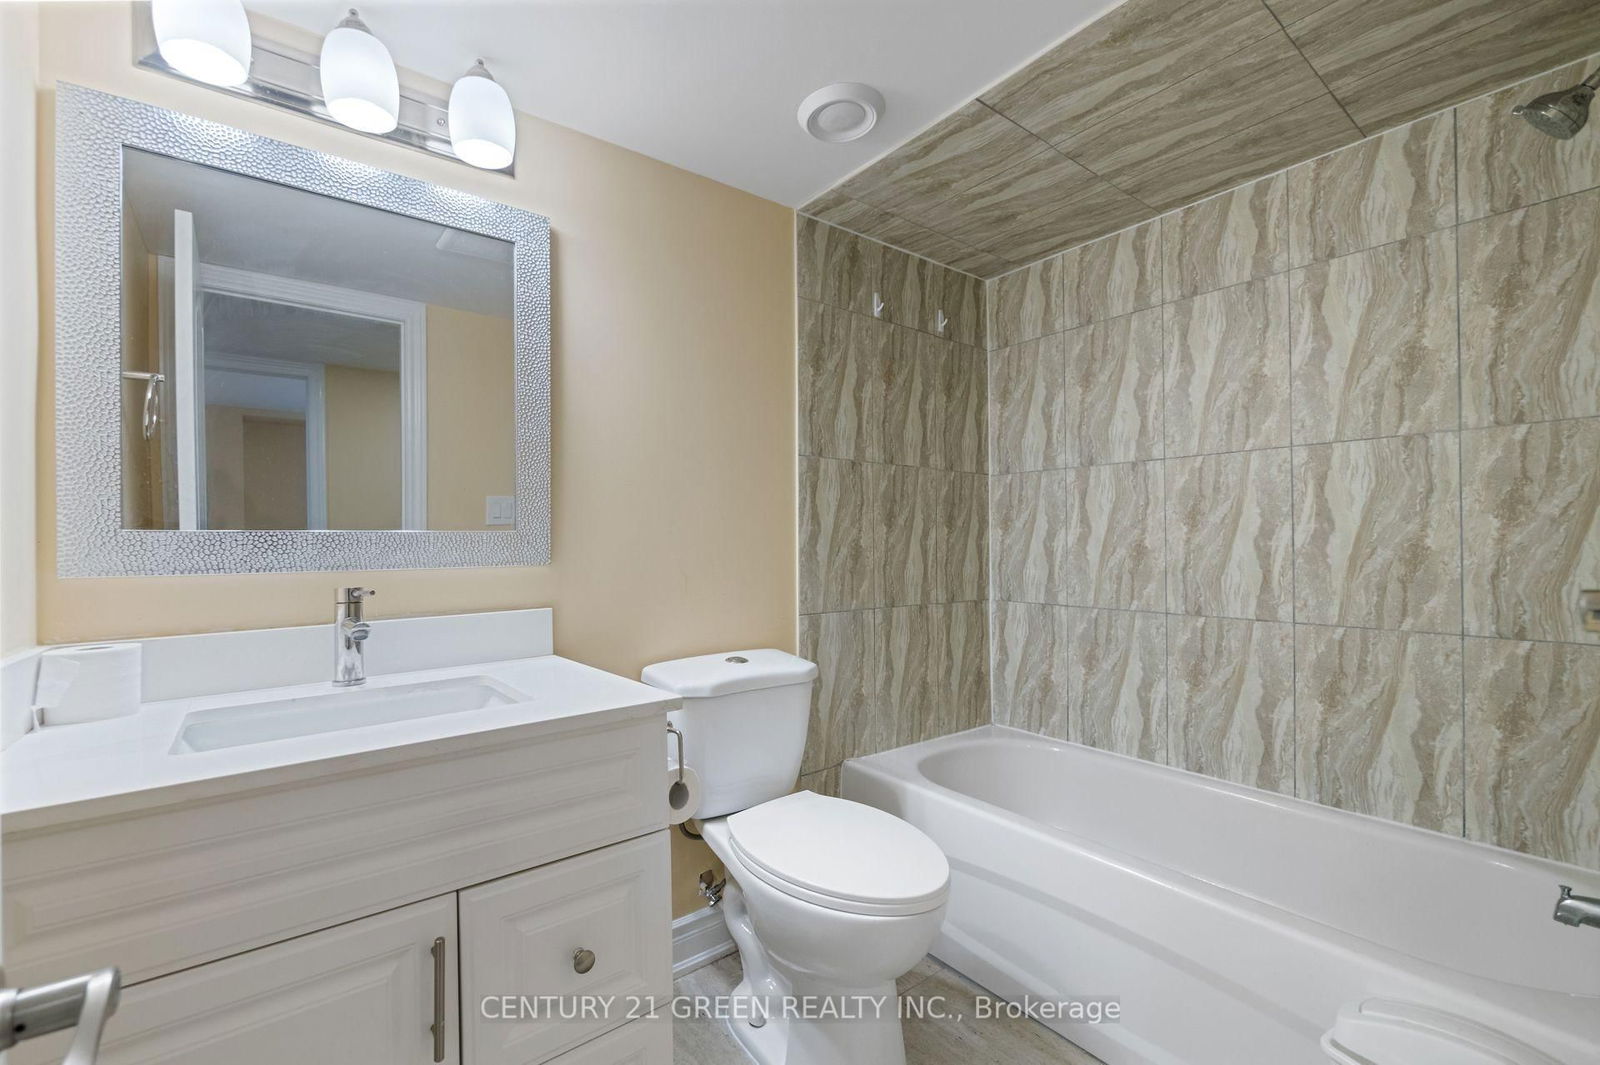
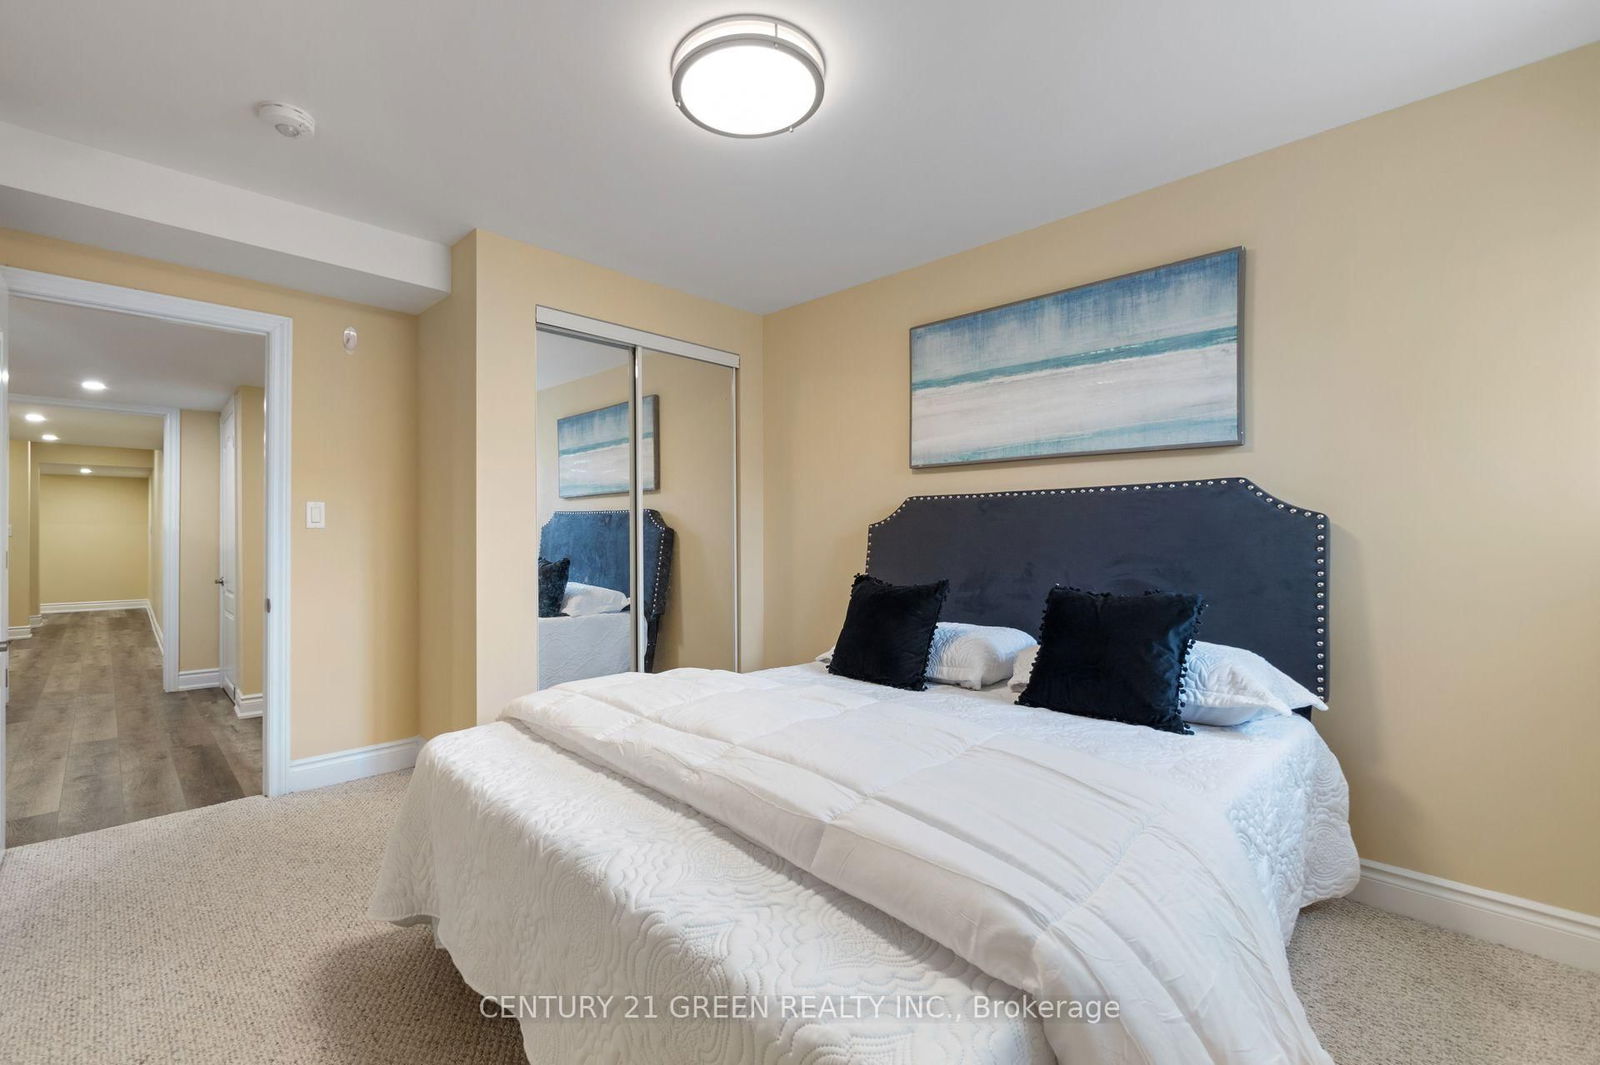
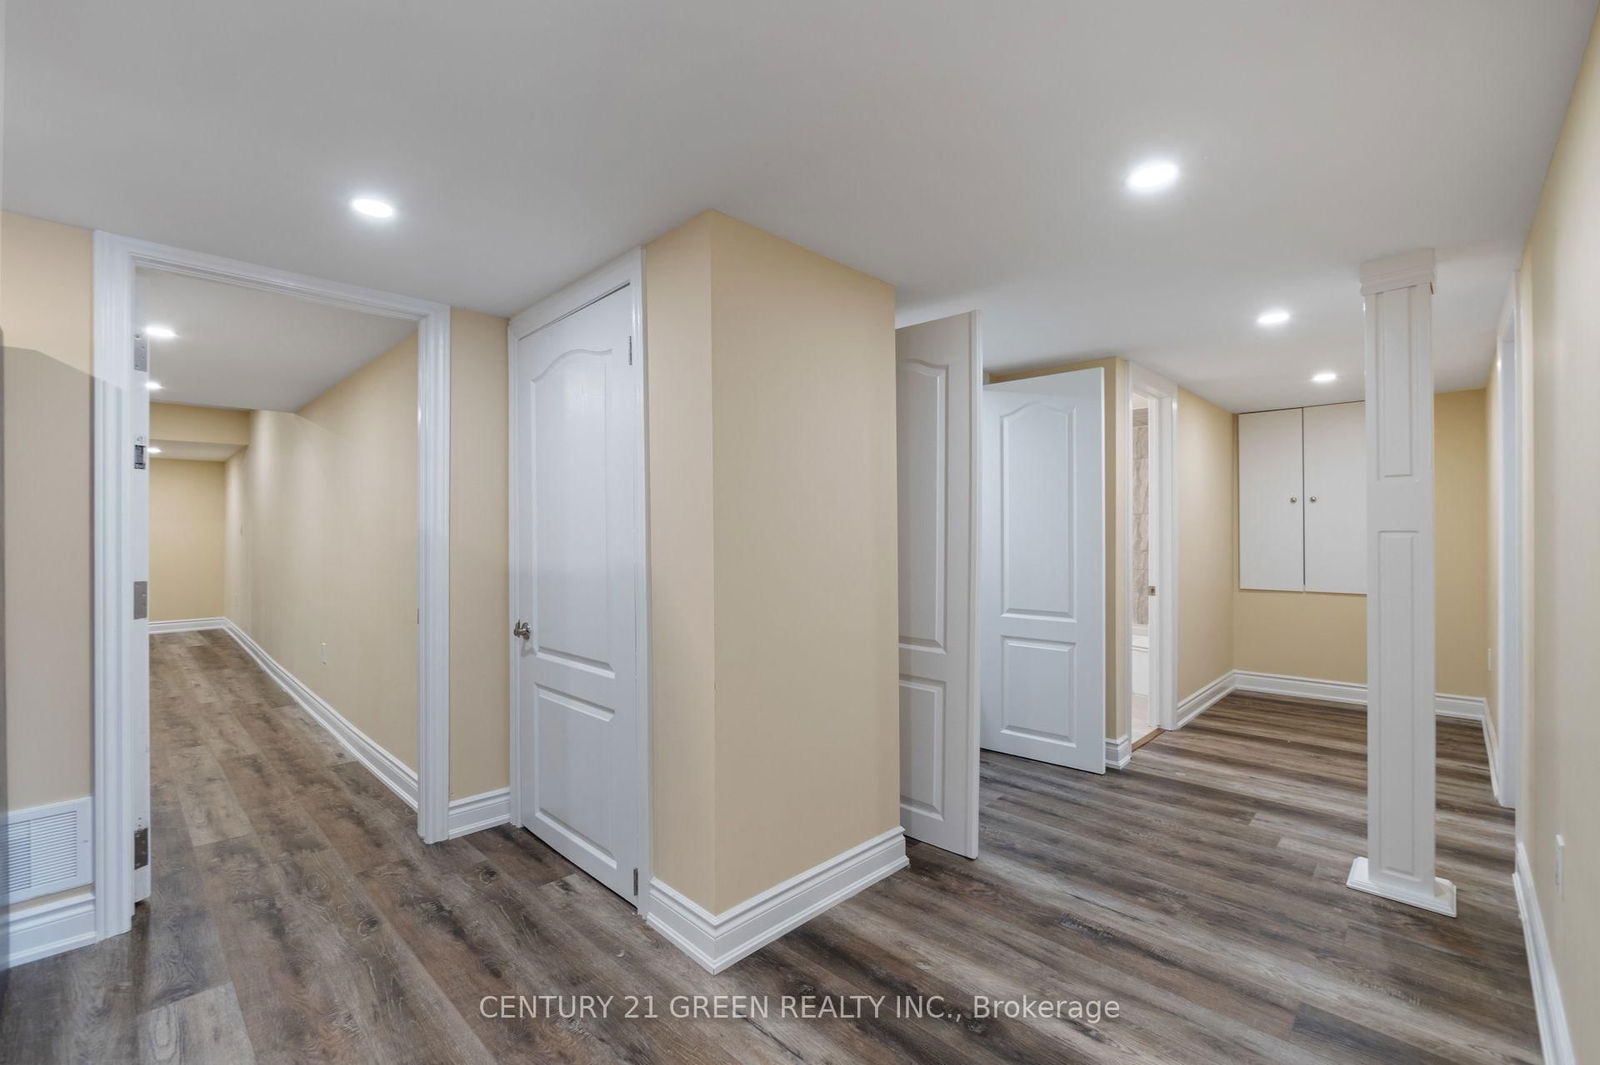
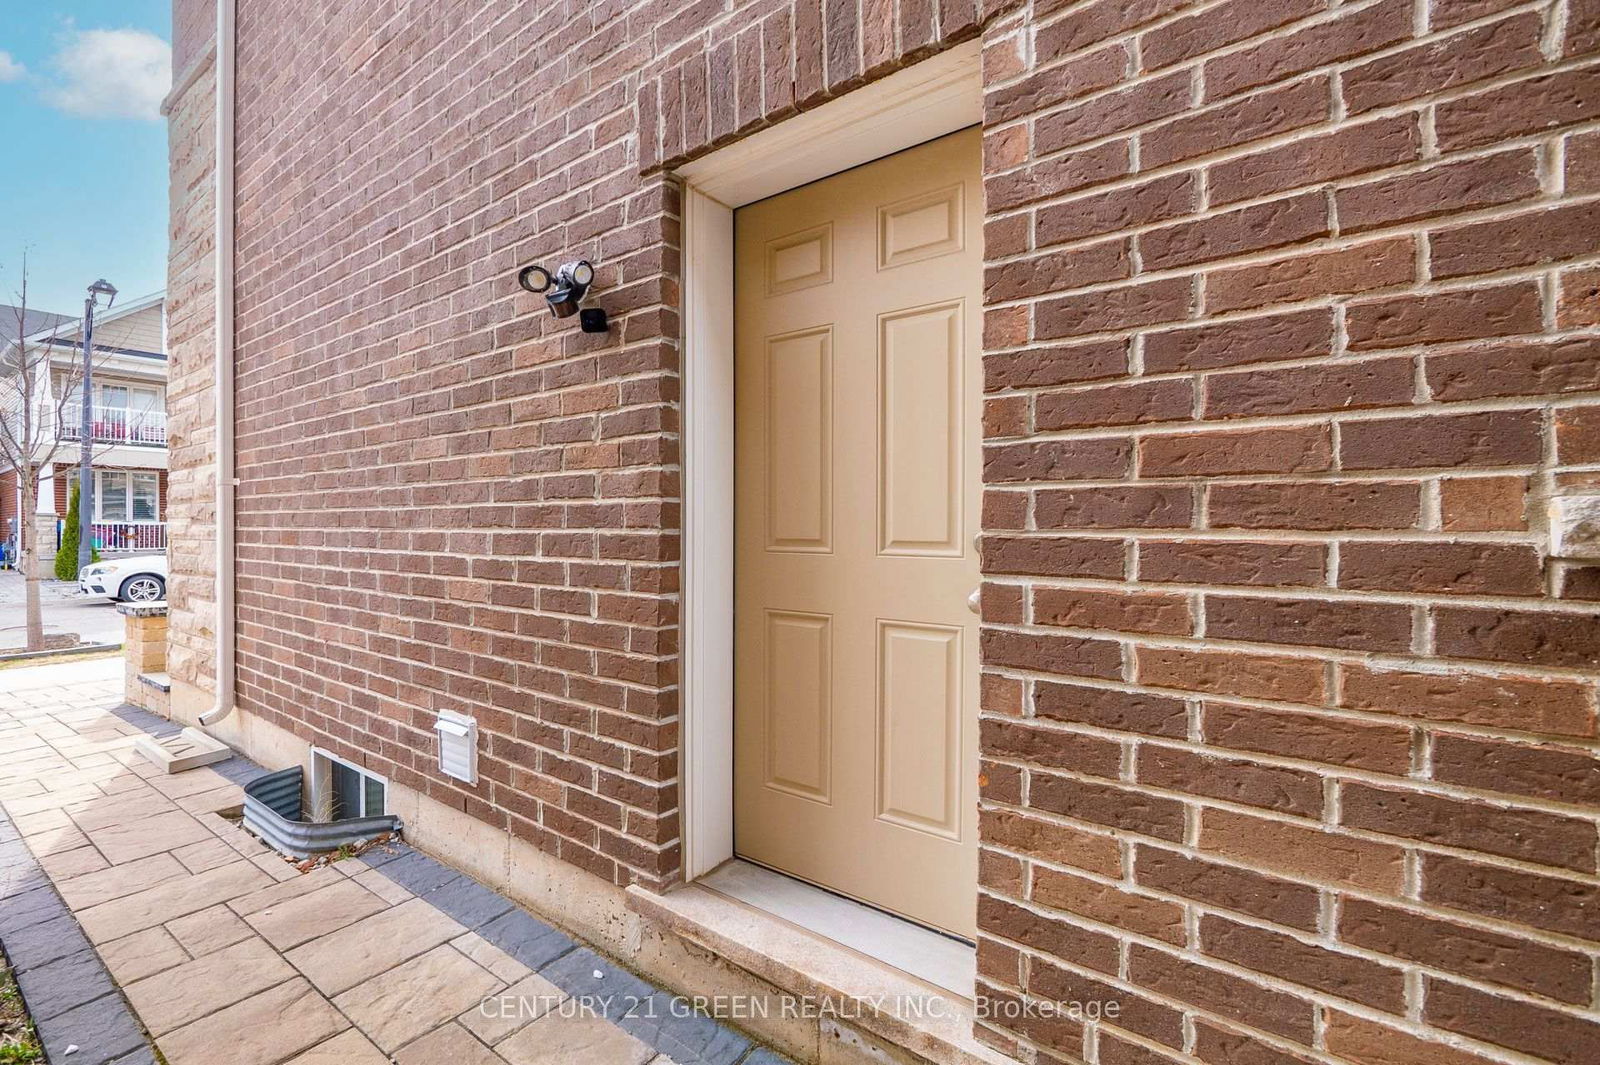
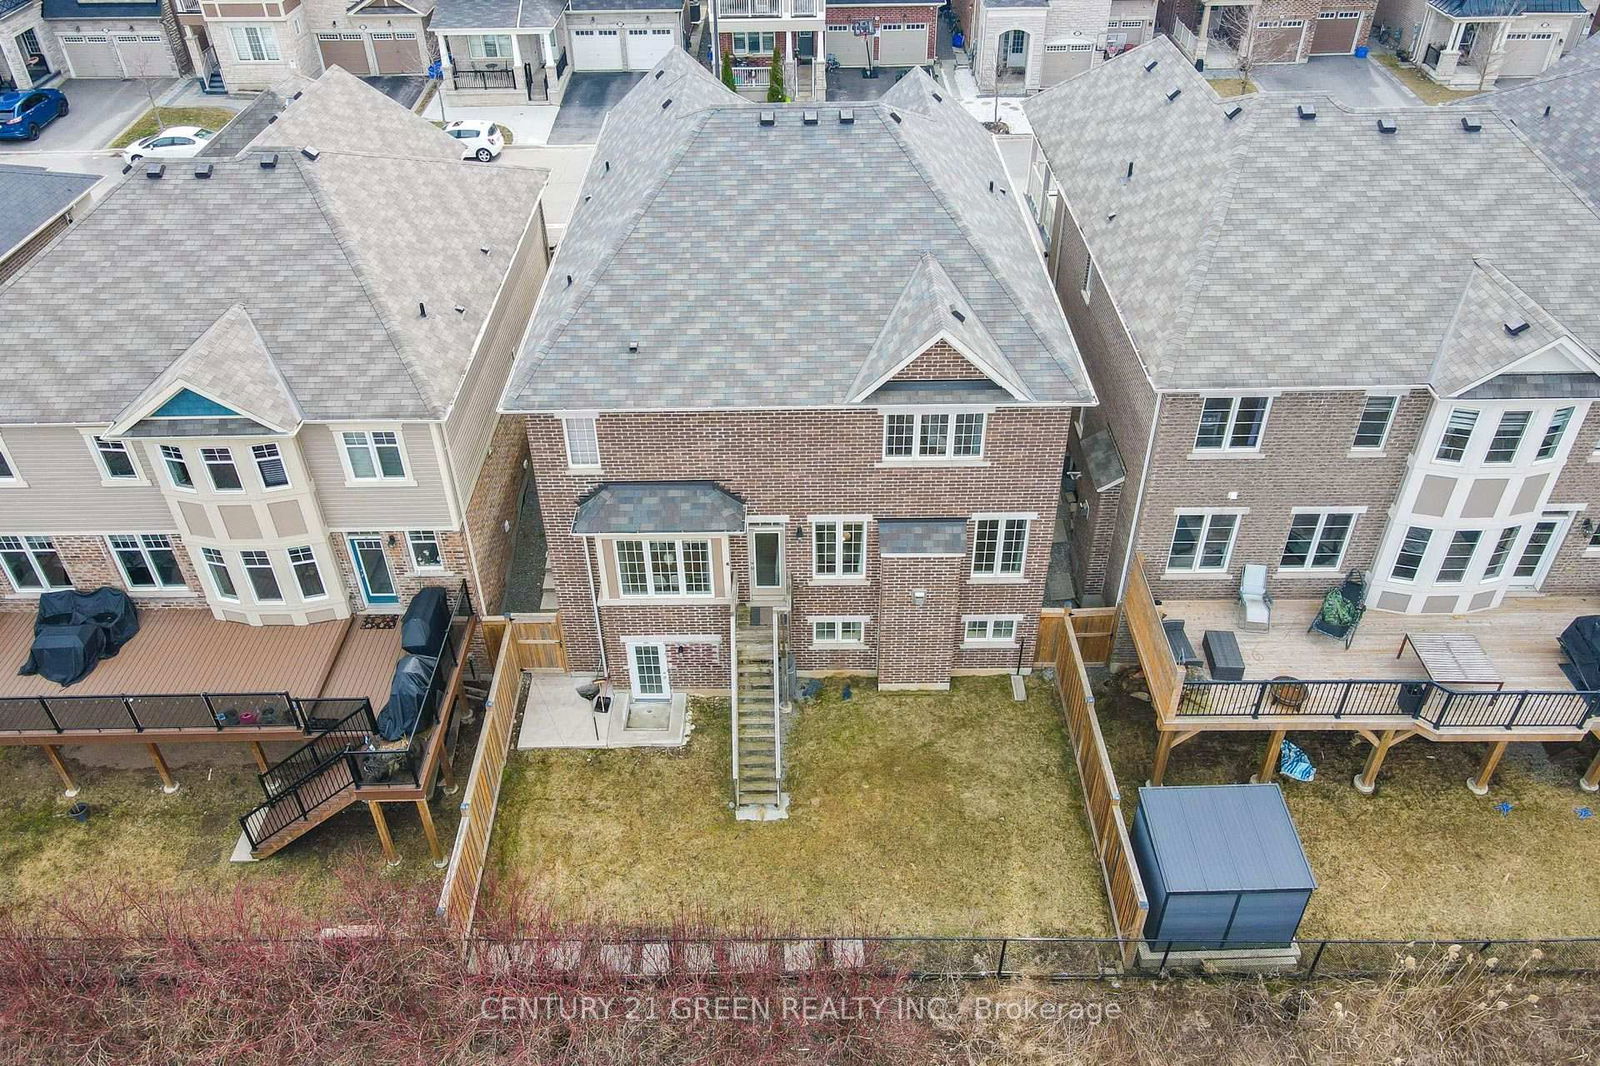
Sure to Impress Even the *Fussiest Buyer!* This stunning property boasts exceptional curb appeal and is one of the largest Mattamy-built homes, featuring 5 + 2 bedrooms and 5 bathrooms, situated on a premium ravine lot. With over *4,400 sq ft* of living space and nearly *$200K* in high-end upgrades, this Energy Star Certified home checks all the boxes on your wish list.*Legal basement apartment* with separate walkout and side entrances Ideal for rental income or extended family.*Interlocking* landscaping, upgraded hardwood flooring, and elegant hardwood stairs.9 ft *High ceilings*, wainscoting, pot lights (interior & exterior), and designer light fixtures, including a statement chandelier. Gourmet *kitchen* with an oversized center island, stainless steel appliances, quartz countertops, backsplash, and gas stove. Gas Fireplace In Family Room. *Luxurious master suite* with breathtaking views and a spa-like ensuite. Three full bathrooms on the second level and a *separate laundry* room for added convenience.*Basement features* a spacious kitchen, 2 large bedrooms, a 3-piece bath, laundry area, ample storage, and walkout to the garden. 200 AMP panel upgrade with an EV charging station in the garage. Gas line extended to the backyard for BBQ and outdoor cooking. Located in a desirable neighborhood with top-rated schools and close to all amenities, this home offers unmatched value and versatility . A MUST-SEE!
Stainless Steel Fridge, Stainless Steel Gas Stove, Stainless Steel Range Hood, Stainless Steel B/I Dishwasher, Front Load Washer And Dryer. R/I Central Vacuum, A/C , All Electrical Light Fixtures, All Window Coverings, Basement Fridge, Basement Stove, Basement Front Load Washer & Dryer
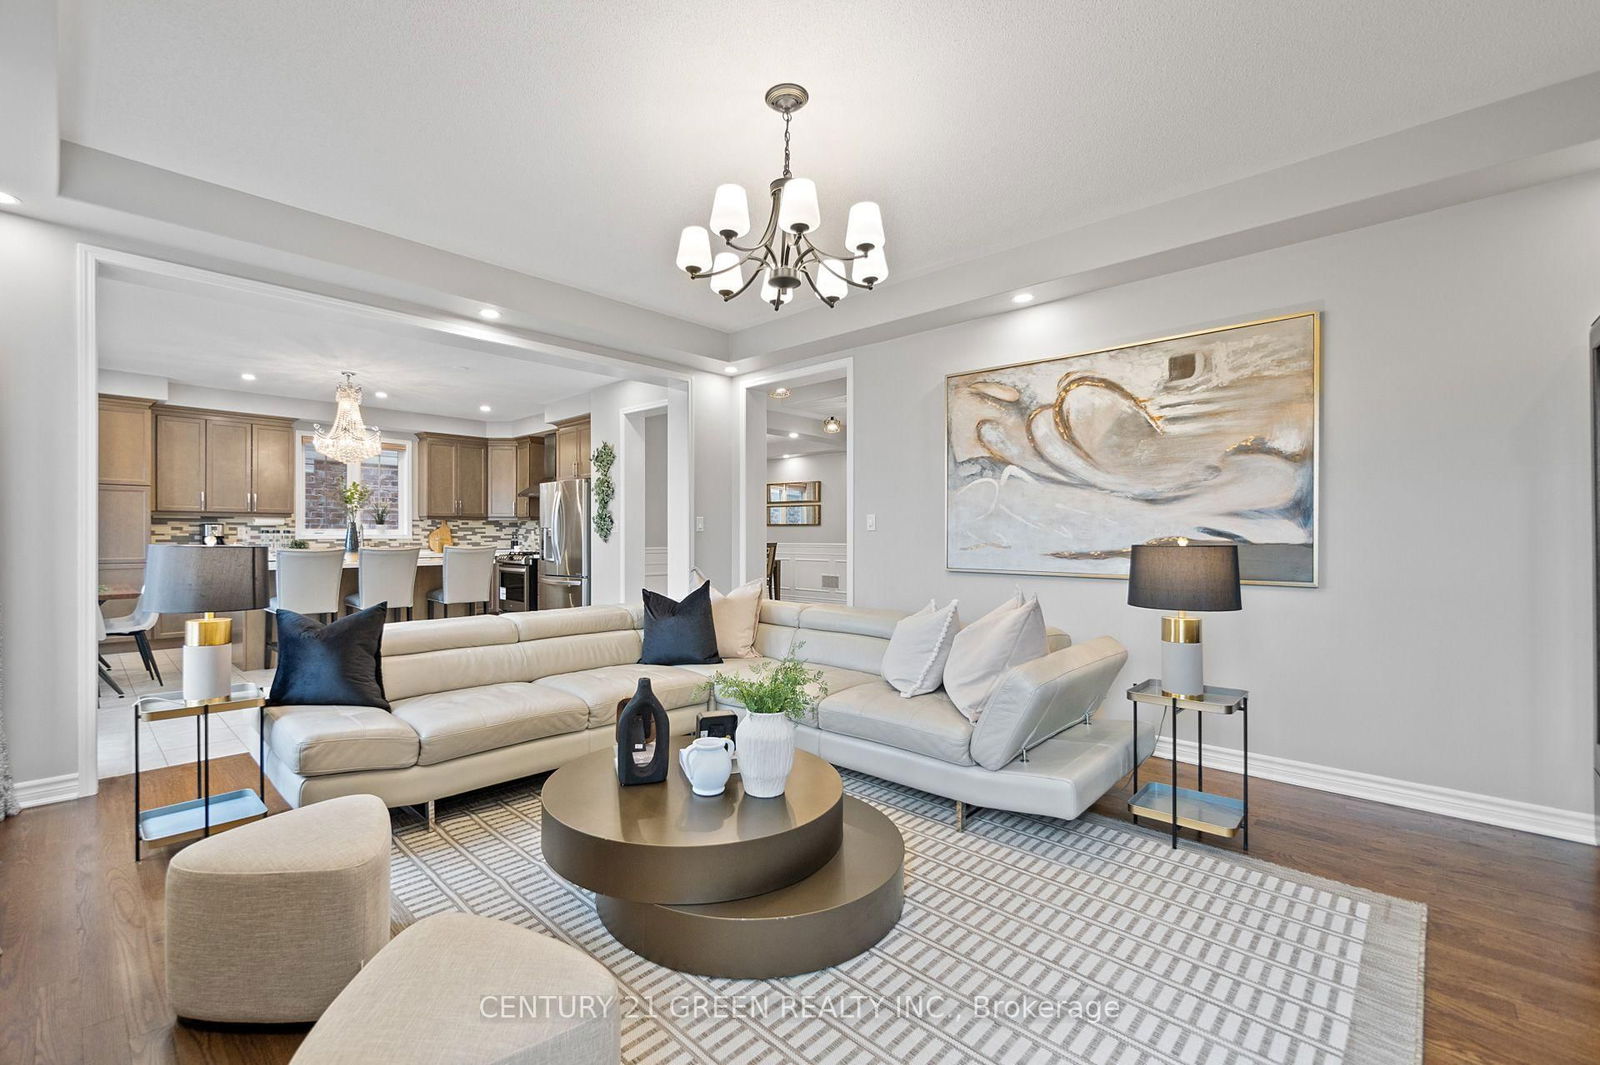
Living
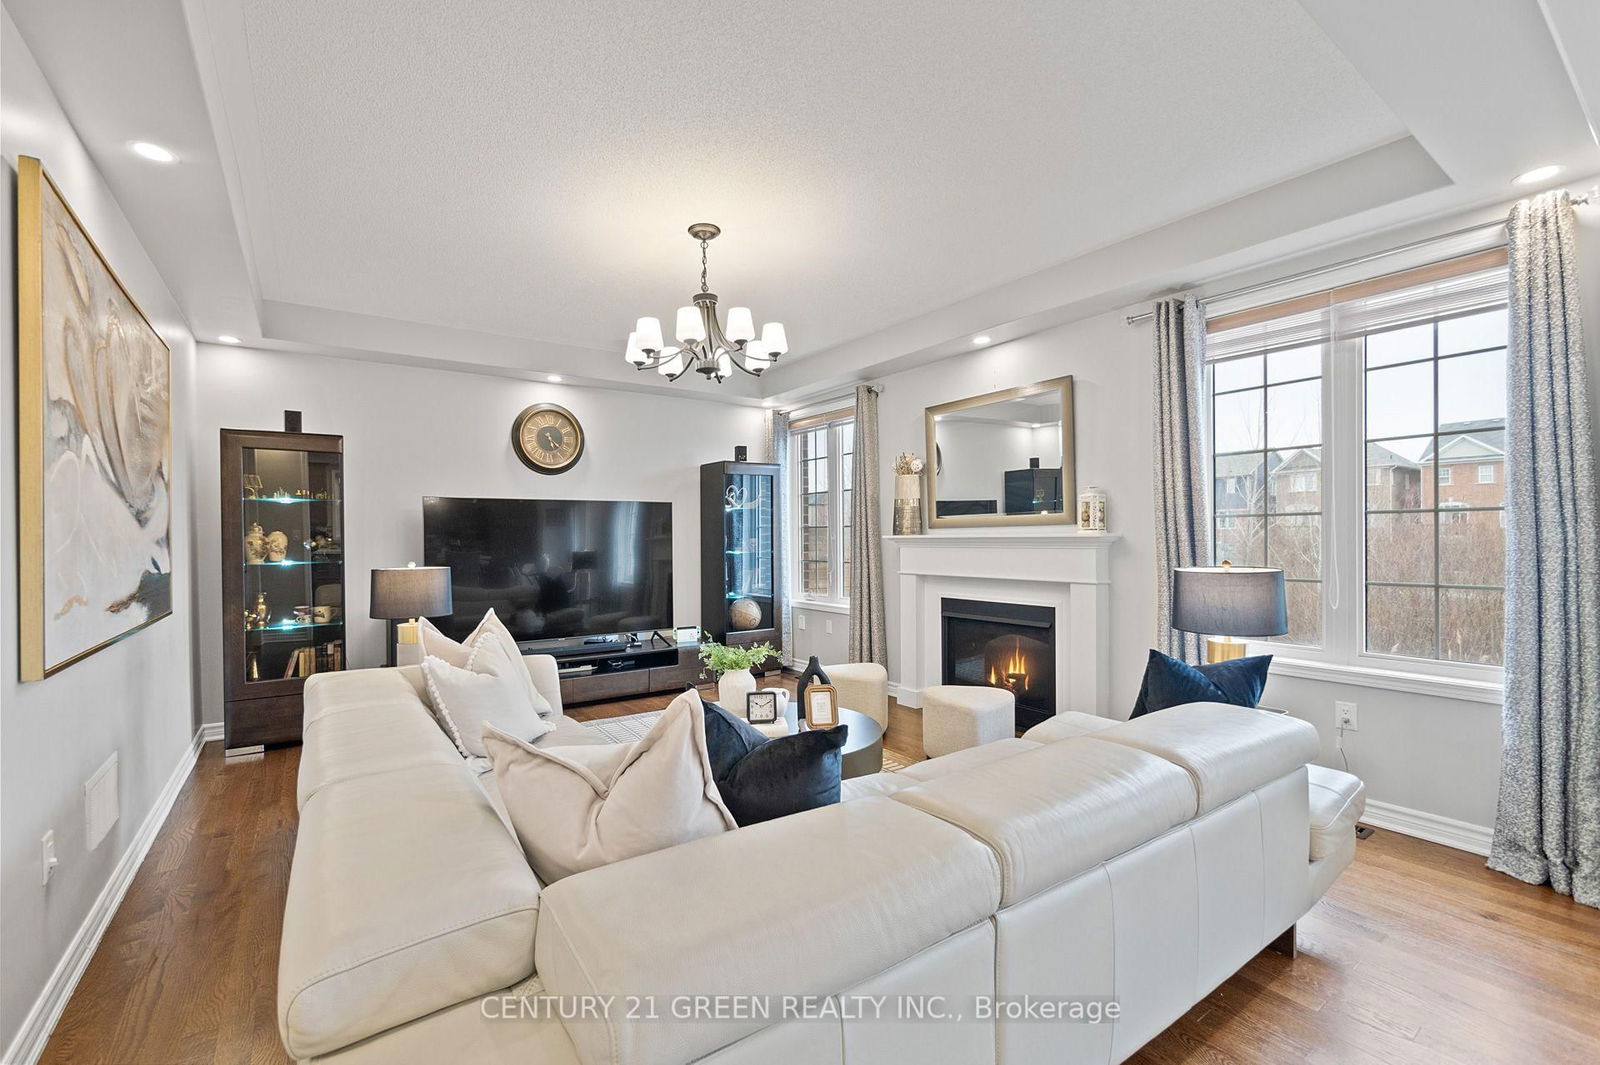
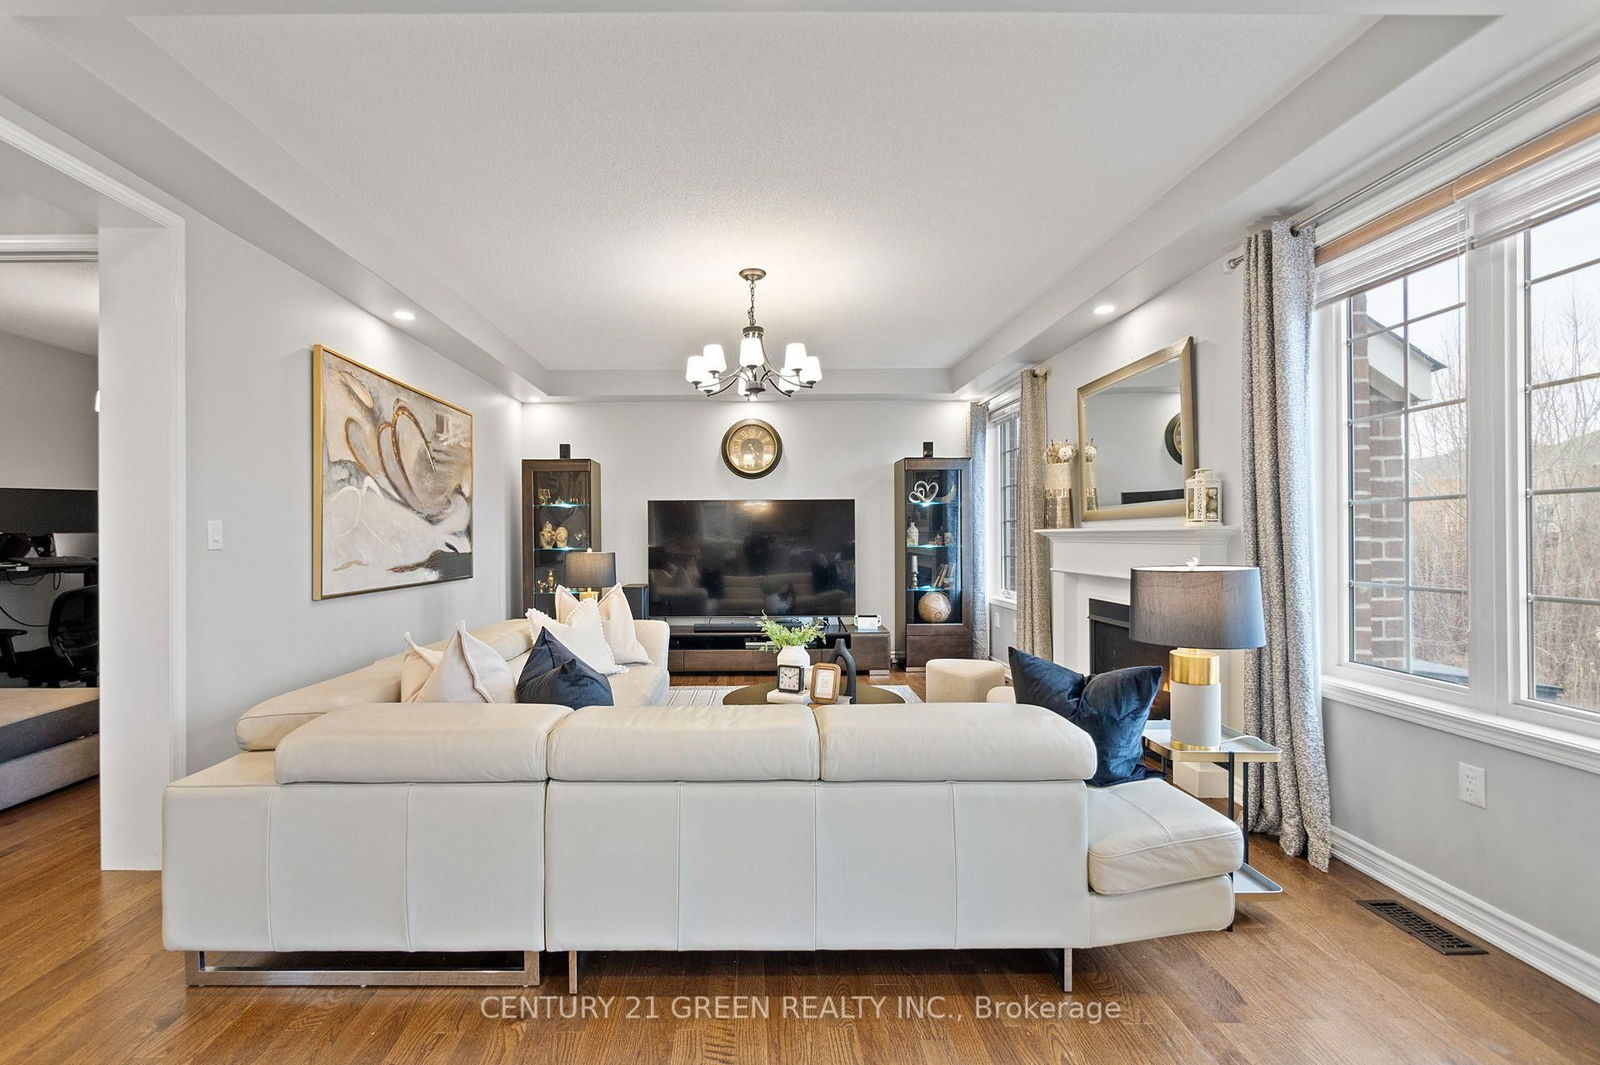
Family
Dining
Kitchen
Breakfast
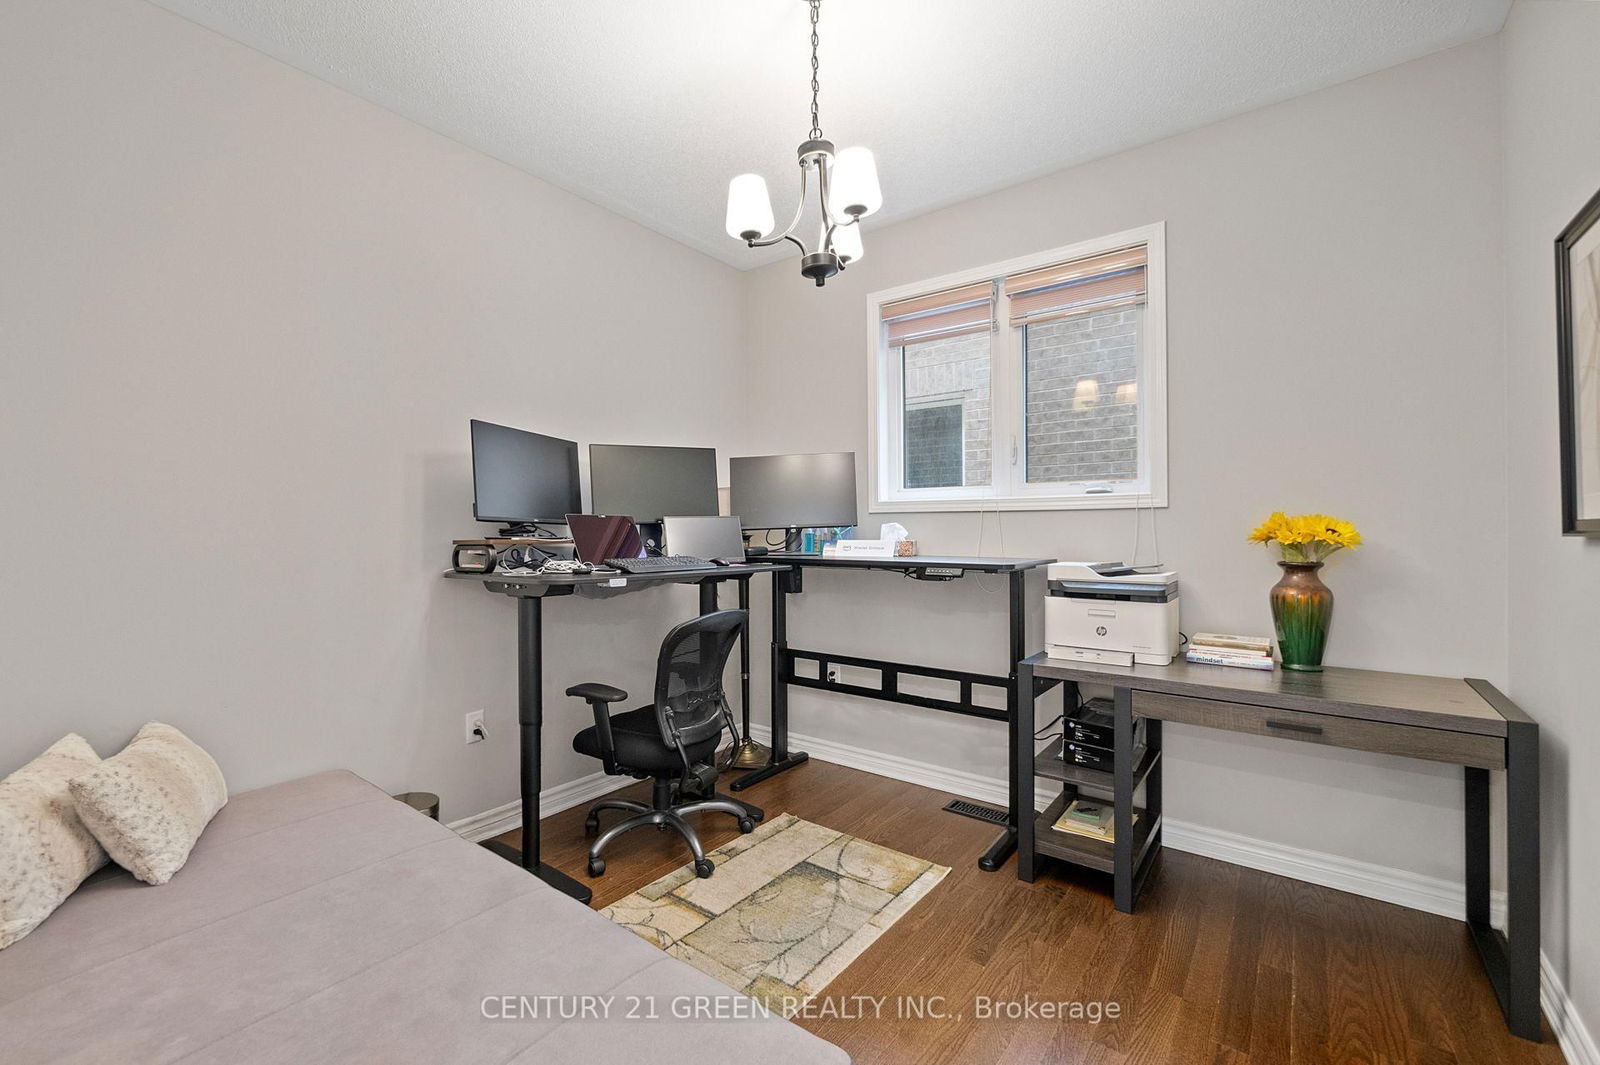
Office
Primary
2nd Br
3rd Br
4th Br
5th Br
The graph below compares the average list price and average sale price of homes in this neighborhood by month for the last 24 months. When average sale price is greater than average list price, this may suggest a buyer's market. When average sale price is lower than the average list price this may suggest a seller's market.
The graph below illustrates the average days on market for homes in this neighborhood. The yellow area may indicate a buyer's market, the green area may indicate a balanced market and the red area may indicate a seller's market.
Sales Representative, Century 21 People’s Choice Realty Inc., Brokerage
(647) 576 - 2100